
PRELIMINARY ECONOMIC ASSESSMENT OF THE LOST CREEK PROPERTY,
SWEETWATER COUNTY, WYOMING
Prepared for Ur-Energy Inc.
Ur-Energy Inc.
10758 W. Centennial Rd. Suite 200
Littleton, CO 80127 USA
REPORT for NI 43-101
Prepared by:
Douglass H. Graves, P.E.
TREC, Inc.
Steve E. Cutler, C.P.G
Roughstock Mining Services, LLC
Effective Date: December 30, 2013

TREC, Inc.
1800 West Koch, Suite 6
Bozeman, Montana 59715
This NI 43-101 Preliminary Economic Assessment titled “PRELIMINARY ECONOMIC ASSESSMENT OF THE LOST CREEK PROPERTY, SWEETWATER COUNTY, WYOMING” dated December 30, 2013 has been prepared and signed by the following authors:
/s/ Mr. Douglass H. Graves, Professional Engineer Wyoming PE 4845 and SME Registered Member 4149627
Dated at Bozeman, Montana
December 30, 2013
/s/ Mr. Steve E. Cutler, Certified Professional Geologist and Member 11103 of the American Institute of Professional Geologists
Dated at Bozeman, Montana
December 30, 2013
| Table of Contents | Page | |
| 1.0 | Summary | 1 |
| 2.0 | Introduction | 7 |
| 3.0 | Reliance on Other Experts | 9 |
| 3.1 | Commodity Sales Price | 9 |
| 4.0 | Property Description and Location | 10 |
| 4.1 | Location and Size | 10 |
| 4.2 | Mining Claims, Mineral Leases and Surface Use Agreements | 12 |
| 4.3 | Title to Property | 12 |
| 4.4 | Property Boundaries | 12 |
| 4.5 | Royalties, Taxes and Fees | 13 |
| 4.6 | Environmental Liabilities | 13 |
| 4.7 | Permitting | 13 |
| 4.8 | Other Relevant Factors | 15 |
| 5.0 | Accessibility, Climate, Local Resources, Infrastructure and Physiography | 15 |
| 5.1 | Topography, Elevation and Vegetation | 15 |
| 5.2 | Access | 15 |
| 5.3 | Proximity to Population Centers | 15 |
| 5.4 | Climate and Operating Season | 16 |
| 5.5 | Property Infrastructure | 16 |
| 5.6 | Water Supply | 17 |
| 6.0 | History | 17 |
| 6.1 | Ownership History of the Lost Creek Property | 17 |
| 6.2 | Exploration History | 20 |
| 6.3 | Previous Mineral Resource Estimates and Their Reliability | 26 |
| 6.4 | Production History | 26 |
| 7.0 | Geological Setting and Mineralization | 28 |
| 7.1 | Regional, Local, and Property Geology | 28 |
| 7.2 | Hydrogeology | 30 |
| 7.3 | Mineralization of the Lost Creek Property | 33 |
| 7.4 | Disequilibrium | 36 |
| 8.0 | Deposit Type | 38 |
| 9.0 | Exploration | 39 |
| 9.1 | URE Exploration – Lost Creek Project | 39 |
| 9.2 | URE Exploration - Adjoining Projects | 40 |
| i |
| 10.0 | Drilling by URE | 41 |
| 10.1 | Explanation of Drill Hole Categories | 41 |
| 10.2 | Drilling - Lost Creek Project | 43 |
| 10.3 | Drilling - LC East Project | 45 |
| 10.4 | Drilling - Other Adjoining Projects | 45 |
| 11.0 | Sample Collection, Preparation, Analysis and Security | 46 |
| 12.0 | Data Verification | 48 |
| 13.0 | Mineral Processing and Metallurgical Testing | 49 |
| 14.0 | Mineral Resource Estimates | 52 |
| 14.1 | Resource Classification | 52 |
| 14.2 | Cutoff Selection | 53 |
| 14.3 | Assumptions | 53 |
| 14.4 | Methodology | 54 |
| 14.5 | Resource Estimation Auditing | 56 |
| 14.6 | Summary of Resources |
57 |
| 14.7 | Mineral Resource Estimate Risk | 61 |
| 15.0 | Mineral Reserve Estimates | 62 |
| 16.0 | Mining Methods | 62 |
| 16.1 | Mineral Deposit Amenability | 62 |
| 16.2 | Mine Development | 63 |
| 16.3 | Piping | 64 |
| 16.4 | Header Houses | 64 |
| 16.5 | Wellfield Reagents, Electricity, Propane | 64 |
| 17.0 | Recovery Methods | 64 |
| 17.1 | Plant Processing | 65 |
| 17.2 | Energy, Water and Process Materials | 66 |
| 17.3 | Liquid Disposal | 66 |
| 17.4 | Solid Waste Disposal | 66 |
| 18.0 | Project Infrastructure | 67 |
| 18.1 | Roads | 67 |
| 18.2 | Laboratory Equipment | 67 |
| 18.3 | Electricity | 68 |
| 18.4 | Holding Ponds | 68 |
| 19.0 | Market Studies and Contracts | 68 |
| 20.0 | Environmental Studies, Permitting, Social or Community Impact | 69 |
| 20.1 | Environmental Studies and Issues | 69 |
| 20.2 | Byproduct Disposal | 71 |
| ii |
| 20.3 | Permitting Requirements, Permit Status, Financial Assurance | 71 |
| 20.4 | Community Affairs | 71 |
| 20.5 | Project Closure | 71 |
| 21.0 | Capital and Operating Costs | 72 |
| 21.1 | Capital Cost Estimation (CAPEX) | 72 |
| 21.2 | Operating Cost Estimation (OPEX) | 73 |
| 22.0 | Economic Analysis | 73 |
| 22.1 | Assumptions | 73 |
| 22.2 | Cash Flow Forecast and Production Schedule | 76 |
| 22.3 | Taxation | 76 |
| 22.4 | Sensitivity Analysis | 77 |
| 23.0 | Adjacent Properties | 77 |
| 24.0 | Other Relevant Data and Information | 77 |
| 25.0 | Interpretation and Conclusions | 77 |
| 25.1 | Risk Assessment | 78 |
| 25.2 | Conclusions | 79 |
| 26.0 | Recommendations | 79 |
| 26.1 | Development | 80 |
| 26.2 | Exploration | 80 |
| 27.0 | References | 82 |
| 28.0 | Certificates | 85 |
| 29.0 | Illustrations | 87 |
| iii |
| List of Tables | Page | |
| 1 | Lost Creek Property - Resource Summary | 3 |
| 2 | Initial Capital Cost Summary | 6 |
| 3 | Experts | 10 |
| 4 | Drill Hole Summary - Historic and Recent | 23 |
| 5 | Previous Resource Estimates | 27 |
| 6 | Leach Test Results, 2005 | 50 |
| 7 | Metal Values from Core Samples | 50 |
| 8 | Bottle Roll Leach Test Results, 2007 | 51 |
| 9 | KM Horizon Leach Test Results, 2010 | 51 |
| 10 | Lost Creek Property Resources, by Project | 59 |
| 11 | Development Summary, by Resource Areas | 61 |
| 12 | Annual Operating Cost (OPEX) - Summary | 74 |
| 13 | Cash Flow Statement | 75 |
| 14 | Net Present Value versus Discount Rate and IRR | 76 |
|
List of Figures (Section 29.0) |
||
| 1 | General Location Map | |
| 2 | Site Access | |
| 3a | Lost Creek Project - Claim Block, Surface and Mineral Ownership | |
| 3b | LC East Project – Claim Block, Surface and Mineral Ownership | |
| 3c | LC North Project - Claim Block, Surface and Mineral Ownership | |
| 3d | LC South Project- Claim Block, Surface and Mineral Ownership | |
| 3e | LC West Project- Claim Block, Surface and Mineral Ownership | |
| 3f | EN Project - Claim Block, Surface and Mineral Ownership | |
| 4 | Geologic Map of the Great Divide Basin | |
| 5 | Schematic Geologic Cross Section – Lost Creek Project | |
| 6 | Stratigraphic Chart of Project Specific Geology – Lost Creek Property | |
| 7 | Conceptual Uranium Roll Front | |
| 8 | Type Log for the Lost Creek Property | |
| 9 | Resource Map for the Lost Creek Property | |
| 10a | Stratigraphic Cross Section A-A’ – Lost Creek Project | |
| 10b | Stratigraphic Cross Section B-B’ – LC East Project | |
| 11 | Resource Areas – Lost Creek Property | |
| 12 | Life of Mine - Chart | |
| 13 | Process Flow Diagram | |
| 14 | NPV Sensitivity to Price, OPEX and CAPEX | |
| iv |
Abbreviations
| AEA | The Asset Exchange Agreement with Uranium One Americas, Inc., effective February 27, 2012; and lands acquired through it |
| bgs | Below Ground Surface |
| 214Bi | Bismuth isotope with 214 neutrons |
| BLM | U.S. Bureau of Land Management |
| CIM | Canadian Institute of Mining, Metallurgy and Petroleum |
| CAPEX | Capital Expenditure |
| CPS | Counts Per Second |
| DDW | Deep Disposal Well |
| DEF | Disequilibrium Factor |
| DN | Drilling Notice |
| DOE | U.S. Department of Energy |
| eU3O8 | equivalent U3O8 as measured by a calibrated gamma instrument |
| EMC | Energy Metals Corporation |
| EMT | East Mineral Trend, located within the LC East Project |
| °F | Degrees Fahrenheit |
| ft. | Feet |
| GDB | Great Divide Basin |
| GIS | Geographic Information System |
| gpm | Gallons Per Minute |
| GT | Grade x Thickness product (% ft) of a mineral intercept. (Expressed without units) |
| HPU | High Plains Uranium, Inc. |
| i.e. | That Is (for clarification) |
| IX | Ion Exchange |
| ISL | In Situ Leach |
| ISR | In Situ Recovery |
| IRR | Internal Rate of Return |
| K | Thousand |
| kWh | Kilowatt-hours |
| lbs. | Pounds |
| MMT | Main Mineral Trend, located within Lost Creek Project |
| M | Million |
| MU | Mine Unit |
| NI 43-101 | Canadian National Instrument 43-101 (Standards of Disclosure for Mineral Properties) |
| NPV | Net Present Value |
| NRC | U.S. Nuclear Regulatory Commission |
| OPEX | Operating Expenditure |
| PA | Preliminary Assessment (under former NI 43-101 definitions) |
| PEA | Preliminary Economic Assessment |
| P.M. | Prime Meridian |
| PNC | Power Nuclear Corporation |
| PFN | Prompt Fission Neutron, logging technology |
| psi | Pounds Per Square Inch |
| R | Range |
| RA | Resource Area |
| T | Township |
| TD | Total Depth drilled |
| TF | Tonnage Factor |
| v |
| SME | Society for Mining, Metallurgy and Exploration |
| SP | Spontaneous Potential |
| SR | State Route |
| U.S. | United States |
| U | Uranium in its natural isotopic ratios |
| 235U | Uranium isotope with 235 neutrons |
| UIC | Underground Injection Control (pursuant to U.S. Environmental Protection Agency regulations) |
| URE | Ur-Energy Inc. |
| U1 | Uranium One Americas, Inc. |
| U3O8 | A standard chemical formula commonly used to express the natural form of uranium mineralization. U represents uranium and O represents oxygen. |
| WDEQ | Wyoming Department of Environmental Quality |
| WY | Wyoming |
| vi |
| 1.0 | Summary |
This independent Preliminary Economic Assessment (PEA) for the Lost Creek Property (the Property) has been prepared for Ur-Energy Inc. (URE) and its subsidiary, Lost Creek ISR, LLC (LC) by TREC, Inc. (TREC) and Roughstock Mining Services, LLC in accordance with Canadian National Instrument 43-101 Standards of Disclosure for Mineral Projects (NI 43-101). Its objective is to disclose recent material change for the Property which comes in the form of an updated mineral resource estimate prompted by recent drilling, including initial wellfield installation at the Lost Creek Project. The Preliminary Economic Assessment for the Lost Creek Property has been revised to evaluate the impact of the additional identified resources. This report therefore serves to replace the most recent PEA for the Lost Creek Property dated April 30, 2012 and covers activities conducted through August 31, 2013.
Review by an independent party is necessary in this instance to comply with NI 43-101 which requires an independent review when the total mineral resource has increased by more than 100% since the last independent review. For the Lost Creek Property the last independent review was issued March 16, 2011 (TREC Inc., 2011). Since that report, Ur-Energy has recognized a cumulative increase of mineral resources at the Lost Creek Property of 66% in the Measured and Indicated categories and 505% in the Inferred category. These additional resources are reported collectively within this PEA and within previous PEAs by Ur-Energy dated February 29, 2012 and April 30, 2012.
The Lost Creek PROPERTY represents the composite of six individual contiguous PROJECTS:
Lost Creek Project
LC East Project
LC West Project
LC North Project
LC South Project
EN Project
The Lost Creek Project is considered the core project while the others are collectively referred to as the Adjoining Projects.
The Lost Creek Property is located in the northeast corner of Sweetwater County, approximately 90 miles southwest of Casper, Wyoming. Current total acreage is approximately 41,892 acres of federal mineral claims and state of Wyoming leases (Figures 3a – 3f).
Exploration in the Lost Creek region started in the mid-1960s. Several companies explored portions of the current Property during this early period, including Inexco, Climax (Amax), Kerr-McGee, Humble Oil, and Conoco. By the mid-1970s Texasgulf and Conoco were the primary mineral landholders in what is now the Lost Creek Project, both having made significant discoveries. Texasgulf eventually assumed dominant control in the late 1970s and continued to advance the mineral discoveries until its exit in 1983 due to market conditions. A period of relative inactivity followed for the next 20 years. Cherokee Exploration, Inc. held much of the ground early in this period, selling it to Power Nuclear Corporation (PNC) in 1987. PNC held it until 2000 but conducted limited activity. New Frontiers Uranium, LLC subsequently acquired the property and held it until 2005 when Ur-Energy USA Inc. purchased 100% ownership of the property through the purchase of a wholly-owned company, NFU Wyoming, LLC.
| 1 |
The Adjoining Projects were progressively acquired by URE starting in 2006 as exploration targets to provide resources supplemental to those recognized at the Lost Creek Project. Most were initially viewed as stand-alone projects, but expanded over time such that collectively they represent a contiguous block of land along with the Lost Creek Project. The most recent acquisition included a large block of land acquired through an Asset Exchange Agreement with Uranium One Americas, Inc. (U1) in February, 2012. Most of this acquisition lies immediately east of the Lost Creek Project and became the current LC East Project.
New drill data obtained from the recent drilling campaigns have increased the total drilling inventory for the Lost Creek Property to 5,416 holes and wells with a total footage of 3,083,082 ft. With this new data URE has completed an updated geologic review and herein presents a new Preliminary Economic Assessment for the Lost Creek Property. Since drilling and well installation is on-going, August 31, 2013 has been applied as the cutoff date for compilation of drill data and resource estimation applicable to this PEA. Similarly, comparison of resources made in this report represent the contrast between those reported in the April 30, 2012 PEA against those applicable on August 31, 2013.
The Lost Creek Property is situated in the northeastern part of the Great Divide Basin (GDB) which is underlain by up to 25,000 ft. of Paleozoic to Quaternary sedimentary units (Figures 4, 5 and 6). Rock outcrops in the GDB are dominated by the Battle Spring Formation of Eocene age which also hosts the uranium mineralization considered in this report. The dominant lithology in the Battle Spring Formation is coarse arkosic sandstone, interbedded with intermittent mudstone, claystone and siltstone. Deposition occurred as alluvial-fluvial fan deposits within a south-southwest flowing paleodrainage.
The uranium mineral occurs as roll front type deposits (Figure 7) formed where uranium precipitated from oxidizing groundwaters when it contacted reduced host rock. The majority of uranium mineral throughout the Lost Creek Property occurs within two major mineral trends. The Main Mineral Trend (MMT) lies within the Lost Creek Project and the East Mineral Trend (EMT) occurs in the LC East Project. The main mineralized stratigraphic intervals are identified by URE as the HJ and KM Horizons of the Battle Spring Formation. Additional mineral has been identified within both the MMT and EMT in the overlying FG and DE Horizons and also in the underlying Deep Horizons (Figures 6 and 8). The FG Horizon and to a lesser extent the DE Horizon contain numerous occurrences of significant mineral (see Figure 6 – stratigraphic column). In the MMT, these horizons have not been specifically targeted by drilling. Rather, knowledge of these occurrences was derived from drilling which targeted deeper horizons. The FG Horizon was, however, the specific target of some of the drilling within LC East (historically) and LC South (both historically and by the Company). Mineral within the FG is included within the current resource estimate, except where it lies above the static water table. Mineral within the DE remains insufficient to warrant inclusion in this resource estimate. Furthermore, most of the DE Horizon lies above the water table and thus is not amenable to in situ recovery. Limited exploration drilling by URE has also identified several uranium roll fronts within the Deep Horizons throughout the Property. They remain largely unexplored at this time.
Mineralization within the EMT is similar in most respects to that occurring in the MMT. It is found in the same stratigraphic horizons within the Battle Spring Formation and likewise is separated by virtually the same aquitards (Figures 6, 8, 10 and 10b). Mineralization has been identified from near surface to depths greater than 500 feet, with potential for deeper mineralization. No leach testing has been conducted to date on mineral within the EMT, however leach tests in the MMT have indicated that the mineral is amenable to leaching with an oxidizing bicarbonate solution.
| 2 |
URE has successfully completed the permitting process for its Lost Creek Project. Construction of the Lost Creek plant and installation of Mine Unit 1 was initiated in mid-October 2012 and have both been brought to operational status. Production operations in Mine Unit 1 within the HJ Horizon began on August 2, 2013 and continues to ramp up to full capacity. Additionally, two applications for amendments to the license and permits are currently in preparation; one to authorize production in the KM Horizon within the Lost Creek Project and the other to authorize production in the HJ and KM Horizons within the EMT in the LC East Project.
Resource estimation is based on geologic cutoffs requiring a minimum grade of 0.020% eU3O8 and a grade thickness (GT) equal to or greater than 0.30. The current resources at the Lost Creek Property are reported in Table 1 and illustrated in Figure 9. The Lost Creek Property currently holds a total of 8.655 million pounds eU3O8 in the Measured and Indicated categories plus 4.740 million pounds eU3O8 in the Inferred category. This represents an increase in resources of approximately 4% and 65% respectively when compared to the previous Preliminary Economic Assessment dated April 30, 2012.
Mr. Cutler is of the opinion that the classification of the resources as stated meets the CIM definitions as adopted by the CIM Council on November 27, 2010 (CIM Council, 2010). The mineral resource estimates in this report, based on historical and recent drilling, were reviewed and accepted by Mr. Cutler.
Table 1: Lost Creek Property - Resource Summary
| PROJECT | MEASURED | INDICATED | INFERRED | ||||||
AVG
% eU3O8 |
SHORT
(X 1000) |
POUNDS (X 1000) |
AVG GRADE % eU3O8 |
SHORT
(X 1000) |
POUNDS (X 1000) |
AVG GRADE % eU3O8 |
SHORT
(X 1000) |
POUNDS (X 1000) | |
| LOST CREEK | 0.058 | 3,117 | 3,590 | 0.052 | 2,350 | 2,444 | 0.057 | 1,836 | 2,085 |
| LC EAST | 0.054 | 1,175 | 1,260 | 0.040 | 1,690 | 1,361 | 0.046 | 1,666 | 1,533 |
| LC NORTH | ----- | ----- | ----- | ----- | ----- | ----- | 0.049 | 489 | 482 |
| LC SOUTH | ----- | ----- | ----- | ----- | ----- | ----- | 0.042 | 710 | 603 |
| LC WEST | ----- | ----- | ----- | ----- | ----- | ----- | 0.109 | 17 | 37 |
| EN | ----- | ----- | ----- | ----- | ----- | ----- | ----- | ----- | ----- |
| GRAND TOTAL | 0.057 | 4,292 | 4,850 | 0.048 | 4,039 | 3,805 | 0.051 | 4,718 | 4,740 |
| MEASURED+INDICATED = | 8,332 | 8,655 | |||||||
Notes:
| 1. | Sum of Measured and Indicated tons and pounds may not add to the reported total due to rounding. |
| 2. | Based on grade cutoff of 0.02 percent eU3O8 and a grade x thickness cutoff of 0.30 GT. |
| 3. | Typical ISR industry practice is to apply a GT cutoff in the range of 0.30 which has generally been determined to be a cost-effective cutoff value. This 0.30 GT cutoff was used in this evaluation without direct relation to an associated price. |
| 4. | Measured, Indicated, and Inferred Mineral Resources as defined in Section 1.2 of NI 43-101 (the CIM Definition Standards (CIM Council, 2010)). |
| 5. | Resources are reported through August 31, 2013. | |
| 6. | All reported resources occur below the static water table. |
Resources within the Lost Creek Property have been geographically allocated to 12 designated Resource Areas (RAs) (Table 11) which represent the accumulation of resources within a given horizon in a given area. In essence, Resource Areas represent precursors to potential Mining Units (wellfields), as discussed in Section 16.2. To date, RAs 1 and 2 have been converted to Mine Units 1 and 2 respectively.
| 3 |
New information has been gained since April 30, 2012 for the Lost Creek Property through the following activities (see also Table 4 Drilling Summary):
Lost Creek Project:
| · | Drilling and installation to date of 914 production pattern wells in Mine Unit 1 (formerly RA1). |
| · | Drilling 143 delineation holes in Mine Unit 2 (formerly RA2) and Mine Unit 1 (RA1). |
| · | Drilling and installing 80 perimeter and interior monitor wells in Mine Unit 2 (RA2) as the precursor to development. |
| LC East Project: |
| · | Drilling 164 delineation holes in RAs 7 and 8, plus 16 exploration holes for stratigraphic control in the north and central portions of the Project. |
| · | Drilling and installation of 26 baseline monitor wells throughout the Project. This does not count five wells subsequently abandoned for various reasons. |
The geological evaluation of the data from the 1,343 new drill holes and wells has resulted in the following changes when compared to the April 30, 2012 PEA:
| · | An increase of resources assigned to Mine Unit 1 (RA1). Close-spaced pilot drilling for production pattern wells added approximately 40% to MU1 Measured plus Indicated resources. This new drilling revealed that mineral horizons are thicker, of higher grade and more extensive than previously estimated. The average grade for MU1 also increased from approximately 0.055% to 0.066% eU3O8. In addition, the new data from the additional drilling upgraded all previous Indicated resources in MU1 into the Measured category. |
| · | An increase in the resources assigned to the LC East Project. Extension drilling of known mineral trends has added approximately 2% to the Measured + Indicated category and 88% to the Inferred category. |
| · | An increase in KM resources underlying Mine Unit 2 (RA2). Delineation drilling added approximately 69% to the Measured plus Indicated resources and 475% to the Inferred resources. This increase warrants designation of these resources as a new Resource Area: RA12. |
As discussed above, the new data gained in Mine Unit 1 from developing the resources with close-spaced pattern wells revealed an additional 40% of resources in the Measured plus Indicated category compared to the pre-development estimation. With that knowledge and experience, the resource estimation criteria were reviewed and revised slightly to provide future resource estimates more consistent with results seen in initial production drilling. Using the revised criteria, the resources for all the Project areas were re-examined and revised where necessary. The changes primarily involved relaxing the criteria somewhat for the Inferred category. Significant changes, when compared to the April 30, 2012 PEA, are:
| · | In Mine Unit 2 (RA2) resources saw a net decrease and a shift in resource categorization. The latest resource reassessment was preceded by a more comprehensive stringent evaluation and mapping of roll fronts in that area. The most significant consequence of this was a net decrease by approximately 34% in the Measured + Indicated resources from 2.424 million lbs. to 1.606 million lbs., due largely to downgrading from the Indicated into the Inferred category. For the same reason, the Inferred resources increased from zero lbs. previously assigned to that category to 316 thousand lbs. |
| 4 |
| · | An increase in LC North resources of 84 thousand lbs. in the Inferred category. |
| · | There has been no change in resources for the LC West, LC South and EN Projects. |
For the Lost Creek Property as a whole, the recent activities have generated a net increase of 307 thousand pounds of resources in the Measured and Indicated categories, plus 1.871 million pounds in the Inferred category, as detailed below:
| Measured: | Net gain of 651 thousand lbs. (16%) |
| (mostly as new resources in MU1 less some downgrades from Measured to Indicated in other Resource Areas due to the revised criteria) | |
| Indicated: | Net loss of 345 thousand lbs. (8%) |
| (mostly as previously identified Indicated resources in MU2 downgraded to Inferred, as discussed above) | |
| [Net Measured + Indicated change = Gain of 307 thousand lbs. (4%)] | |
| Inferred: | Net gain of 1.871 million lbs. (65%) |
| (partially as new resources in LC East, and partially as Indicated resources in MU2 downgraded to Inferred) | |
The gained mineral resources are distributed by Project as:
| Lost Creek Project | ||
| Measured and Indicated: | 269 thousand lbs. | (mostly HJ Horizon in MU1) |
| Inferred | 1.070 million lbs. | (mostly in MU2 as new KM |
| resources and as downgraded HJ | ||
| resources | ||
| LC East Project: | ||
| Measured and Indicated: | 38 thousand lbs. | (mostly in RAs 7 and 8) |
| Inferred: | 718 thousand lbs. | (mostly in RAs 7 and 8) |
| LC North Project: | ||
| Inferred: | 84 thousand lbs. | (as discussed above) |
With the addition of the resources mentioned above, the total mineral resource for the Lost Creek Property currently stands at 8.655 million lbs. in the Measured and Indicated categories plus an additional 4.740 million lbs. as Inferred (Tables 1 and 10).
The new resources identified via the recent activities and evaluations have been added to the Lost Creek production plan and provide a positive impact on the possible economics of the Property. Using the estimated CAPEX, OPEX and closure costs presented herein, a cash flow statement has been developed and is provided in Table 13. The statement assumes no escalation, no debt interest or capital repayment. It also does not include depreciation. It should be noted that Ur-Energy Inc., through its wholly-owned subsidiary Lost Creek ISR, LLC, is the recipient of a State of Wyoming Taxable Industrial Development Bond (URE News Release, October 24, 2013). Debt interest and repayment of this bond is not included in the economic analysis. This information is discussed in more detail in Section 22.0 to Section 22.2
The Lost Creek Property economic analysis includes tax estimates for state severance taxes, county ad valorem taxes and property taxes, all of which are directly attributable to the Property. Federal income tax is excluded. Ur-Energy USA Inc. files consolidated federal tax returns in the United States and had approximately $59.2 million in tax loss carry forwards as of December 31, 2012. The Company does not anticipate paying federal income taxes until the existing, and any future, tax loss carry forwards are utilized. In addition, reclamation costs can be deducted in the early years of the project, thus also pushing out the tax liability. Estimating federal income taxes for the Lost Creek Property therefore becomes speculative and, as a result, has not been included in this Preliminary Economic Assessment.
The sale price for the produced uranium is assumed to vary based on an average of the projections of RBC Capital Markets, Dundee Capital Markets, J.P. Morgan Securities, Raymond James Ltd. and the actual contractual commitments URE has in place. The revenue for the cash flow estimate was developed using the GT contour mineral resource estimate for the MMT and EMT, and further assumes that, based on an 80% recovery factor, approximately 9.2 million pounds of U3O8 will be recovered from the MMT and the EMT at the Lost Creek Property.
| 5 |
Remaining CAPEX costs are for sustaining capital requirements at the minesite and are primarily associated with replacement equipment used in future operations of the plant and the wellfields. The sustaining capital cost is estimated to be $1.7million. The sustaining capital estimate is based on the actual previous purchases of the same equipment and/or vendor prices, thus the predicted level of accuracy of the sustaining capital estimate is +/- 10%.
The Lost Creek Project’s initial capital costs have already been spent during construction of the plant, the initial Resource Area, and the drilling and construction of the two deep disposal wells (DDWs). As described, URE has purchased and paid for the processing plant and much of the first mine unit prior to the date of the economic calculations (September, 2013). Costs for that equipment (approximately $46.5 million) are included in the cash flow model in Year 2013 under the heading “Initial Capital” and are detailed below in Table 2.
Table 2: Initial Capital Cost Summary
| Equipment | Cost |
| Rolling Stock | $1,651,492 |
| General Site Equipment and Utilities | $429,918 |
| Plant Equipment & Engineering | $9,315,011 |
| Plant and General Shop | $14,371,221 |
| Drill Shed | $51,041 |
| Access Road | $1,326,552 |
| Disposal Wells | $3,638,154 |
| Wellfield Development | $12,333,260 |
| Other Construction | $1,786,151 |
| Lost Creek ISR, LLC Labor | $1,573,442 |
| Total Capital Cost | $46,476,241 |
OPEX cost estimates were developed by evaluating each process unit operation and associated operating services (power, water, air, waste disposal), infrastructure (offices, shops), salary plus burden, and environmental control (heat, air conditioning, monitoring). The OPEX estimate is based on URE’s development plan, deliverables, process flow sheets, process design, materials balance and project manpower schedule. The annual OPEX is provided in Table 12.
Construction of the plant and first mine unit (wellfield) began in October 2012. Plant construction was completed in the third quarter of 2013. Wellfield drilling and construction activities have been completed to various levels with the majority of the work occurring in the first mine unit.
The Net Present Value (NPV) calculations assume that cash flows occur in the middle of the accounting periods. The NPV is calculated from the discounted cash flow model and is based on the CAPEX, OPEX and closure cost estimates, a variable future uranium price and the anticipated production schedule. The Property is estimated to generate net cash flow over its life, before income tax, of $319.7 million. Payback is estimated during the second quarter of 2015. The Property has a calculated before tax IRR of 74.5% and a before tax NPV of $198.3 million applying an 8% discount rate. The estimated cost of uranium produced is $29.13 per pound including severance taxes plus all operating and capital costs, with an estimated operation cost of $11.54 per pound.
| 6 |
Cautionary statement:
This Preliminary Economic Assessment is preliminary in nature, and includes inferred mineral resources that are considered too speculative geologically to have the economic considerations applied to them that would enable them to be categorized as mineral reserves. The estimated mineral recovery used in this Preliminary Economic Assessment is based on site-specific laboratory recovery data as well as URE personnel and industry experience at similar facilities. There can be no assurance that recovery at this level will be achieved.
The Authors have assumed that URE’s operations at the Property will be conducted in conformance with applicable laws, regulations and requirements of the various federal and state agencies. It is also assumed that organization and management controls have been and will continue to be established to ensure compliance with applicable regulations and implement URE’s policy for providing a safe working environment including the philosophy of maintaining radiation exposures As Low As Reasonably Achievable (ALARA).
The Authors find the Property is potentially viable based on the assumptions contained herein. There is no certainty that the mineral recovery or the economic analysis presented in this PEA will be realized. In order to realize the full potential benefits described in this PEA the following activities, as discussed in Section 26, are required:
| · | Further delineation of Mine Unit 2 |
| · | Further delineation and exploration of LC East |
| · | Amend Permit Area and apply for the required permits for KM production and LC East production |
| 2.0 | Introduction |
TREC, Inc. (TREC), with its subcontractor, Roughstock Mining Services, LLC has been retained by Ur-Energy Inc. (URE) to prepare this independent Preliminary Economic Assessment (PEA) for the Lost Creek Property (the Property), which includes the Lost Creek Project (the Project) and the Adjoining Projects located in northwestern Sweetwater County in south-central Wyoming, USA (see Figures 1 and 2). This PEA has been prepared for URE in accordance with the guidelines set forth under National Instrument (NI) 43-101 for the submission of technical reports on mineral properties. This PEA also presents an independent validation of the estimate of Measured, Indicated and Inferred Mineral Resources as defined in Section 1.2 of NI 43-101. Estimates of Mineral Reserves are not included.
| 7 |
This Preliminary Economic Assessment was prepared to disclose the results of geological resource evaluations for the Lost Creek Property prompted by recent drilling and development activities through August 31, 2013. Company geologists have determined that the recent activities have increased the known resource within the Lost Creek Property which is available for current and proposed production at the Lost Creek Project. A review by an independent party is necessary to comply with Canadian National Instrument 43-101 “Standards of Disclosure for Mineral Projects” which requires an independent review when the total mineral resource has increased by more than 100% since the last independent review. For the Lost Creek Property the last independent review was issued March 16, 2011. Since that report, Ur-Energy Inc. has recognized increased mineral resources at the Lost Creek Property as follows:
| · | Measured and Indicated resources have increased by 66% (3.432 million pounds) from 5.223 million to 8.655 million pounds eU3O8; and |
| · | Inferred resources increased by 505% (3.957 million pounds) from 783 thousand to 4.740 million pounds eU3O8. |
This assessment was also performed to endorse the potential economic viability of the Lost Creek Property inclusive of Mine Unit 1 and the Resource Areas within the MMT and EMT.
Completion of this PEA was under the direction of Mr. Douglass H. Graves, P.E representing TREC, Inc., and also Mr. Steve Cutler, C.P.G., (American Institute of Professional Geologists) and geologist with Roughstock Mining Services, LLC, a subcontractor to TREC, Inc. Both individuals are independent Qualified Persons as defined by NI 43-101. Mr. Cutler visited the Lost Creek Property on April 24, 2013. Additionally, Mr. Cutler has approved the technical disclosure contained in this report, and has verified the sampling, analytical and test data underlying the mineral resource estimate. Mr. Graves visited the site on April 24, 2013. The purpose of the visits was to observe the geography and geology of the Project site, verify work done at the site by URE, observe the potential locations of Property components, current site activities, and location of exploration activities and gain knowledge on existing site infrastructure.
Preparation by the Authors is based on information provided by URE and other professional consultants, and generally accepted uranium ISR practices. Mineral resource estimates are based on exploration, delineation and production drilling, and associated data, provided by URE and independently evaluated by Mr. Cutler.
URE was incorporated on March 22, 2004 and is a junior exploration company engaged in the identification, acquisition, evaluation, exploration, development and operation of uranium mineral properties in the United States and Canada. The Company’s U.S. land portfolio includes properties in the Great Divide Basin, Shirley Basin and the Black Hills region of Wyoming, as well as properties in western Nebraska. The Company also holds exploration properties in the Northwest Territories and Nunavut, Canada.
The wellfield design was provided by URE with associated numbers and locations of wells and header houses. It includes the as-built design in Mine Unit 1 as well as anticipated wellfield layout for future developments. The cost estimates presented herein are based on wellfield layouts, process flow diagrams, tank and process equipment and buildings currently installed at the Property, personnel and capital equipment requirements provided by URE.
The Capital Cost (CAPEX) and Operating Cost (OPEX) estimates were developed primarily from URE bid and operating information, TREC cost data, historical information, and vendor quotes for similar ISR projects currently being designed or in production in the United States. Where available, costs and quantities from the design, actual purchase orders and contracts have been used. Mineral recovery and performance were assumed based on data provided by URE as well as recovery and performance of similar ISR projects. Unit costs were based on similar facilities, internal budgets, and obtained from vendor quotes and TREC data. Financial modeling was performed by TREC based on anticipated operating schedules and internal costs, local and state taxes and royalties.
| 8 |
Cash Flow and economic indicators are based on total production of 9.2 million pounds (rounded) of U3O8. CAPEX and OPEX costs are presented in 2013 US dollars. No allowance for escalation has been provided. The Authors of this PEA predict the accuracy of the estimates to be within 10% for CAPEX and +/- 20% for OPEX.
Exploratory and mine-development drilling within the Property, conducted by URE, is the primary source of information and data for the mineral resource calculations. Data from historical drilling of approximately 2,430 uranium exploration holes conducted by a series of interests including Amax (Climax) Uranium, Conoco, Inexco, Texasgulf and Power Nuclear Corporation were used to supplement URE’s drilling data (Section 10.0). The mineral resource estimate is based on published and unpublished data including:
| · | Lithologic and geophysical logs; |
| · | Drill hole location data; |
| · | Mineral intercept grade calculations; |
| · | Cross sections constructed from geophysical logs. |
A more detailed discussion of the drilling programs for the Property is provided in Sections 9.0 and 10.0.
Units of measurement, unless otherwise indicated, are feet (ft.), miles, acres, pounds avoirdupois (lbs.), and short tons (2,000 lbs.). Uranium is expressed as pounds U3O8, the standard market unit. All references to dollars ($) are in U.S. dollars. Grades reported for historical resources and the mineral resources reported and used herein are percent eU3O8 (equivalent U3O8 by calibrated geophysical logging unit). ISR refers to in situ recovery, sometimes also termed ISL or in situ leach. A complete list of abbreviations is provided on pages iii-iv.
| 3.0 | Reliance on Other Experts |
For this PEA, the Authors have relied on information from others regarding property ownership, title and mineral rights, capital expenditures, operating expenditures and commodity sales contracts. Additionally, this PEA was prepared by the Authors with reliance on reports and information from others as cited throughout this report and as referenced in Section 27. Table 3 identifies the experts and their contributions and responsibilities in the development of this PEA.
3.1 Commodity Sales Price
URE has completed six uranium supply arrangements at defined pricing within industry norms. The agreements relate to a portion of anticipated production during the defined term and, together with their defined pricing, are considered within the sensitivities in this report (Figure 13). The income from the contracted portion of production, along with the other estimated production at the anticipated sales price, is included in the cash flow estimate presented in Section 22.
| 9 |
Table 3. Experts
| Expert | Contribution/Responsibility |
| Douglass H. Graves, P.E. (QP), Principal of TREC, Inc. | Contributing Author to this PEA, responsible for all or part of Sections 1 –6, 13 and 16 – 29. |
| Steve Cutler, C.P.G. (QP), Technical Services Manager of Roughstock Mining Services, LLC | Contributing Author to this PEA, responsible for all or part of Sections 1, 2, 7-12, 14, 15, 22, 23, 25 and 28. |
| Lathrop & Gage, LLP | Counsel for land and mineral title information |
| Davis Graham & Stubbs, LLP | Counsel for land and mineral title information |
| Roger Smith, C.P.A., M.B.A., CFO and CAO of Ur-Energy Inc. | Assisted with development of the cash flows and economic indicators |
|
Cal VanHolland, B.A, P.G. Chief Geologist, Ur-Energy Inc. |
Preparation of geologic information |
| John Cooper, M.Sc., P.G. Production Geologist, Ur-Energy Inc. | Preparation of geologic information |
| John Cash, M.Sc., VP of Regulatory Affairs, Exploration and Geology of Ur-Energy Inc. | Preparation of environmental information |
| Steve Hatten, B.Sc., VP of Operations of Ur-Energy Inc. | Preparation of capital and operating expenditure information and commodity sales contract information |
| 4.0 | Property Description and Location |
| 4.1 | Location and Size |
The Lost Creek Property (the Property) is located in the northeastern corner of Sweetwater County in south-central Wyoming. As shown on Figures 1 and 2, the Lost Creek Property is in an unpopulated area located approximately 15 miles southwest of Bairoil, Wyoming, about 38 miles northwest of Rawlins, Wyoming and about 90 miles southwest of Casper, Wyoming. It is centered at approximately 42 degrees, 8.06 minutes North latitude and 107 degrees, 51.7 minutes West longitude. All references herein to Township and Range occur within the 6th Prime Meridian.
The Lost Creek plant (Figures 2 and 11) has been constructed and is operating. Production well installation in Mine Unit 1 is near completion and Header Houses 1, 2 and 3 are operational. A second deep disposal well (LC DW #4) has been drilled and tested near the plant site. The plant and associated access roads have been constructed as shown on Figure 2. URE has also installed numerous monitoring and other wells in support of its permit and license applications and to further its mine planning. Various other infrastructure, including wells, water tanks, a meteorological station, and other equipment, has been placed on the Property by URE in support of its mining, development, exploration, and permit/license activities.
| 10 |
The Property currently comprises six individual Projects named the Lost Creek, LC East, LC North, LC South, LC West, and EN Projects (Figures 1 and 2) with a total of 41,892 acres; all within the 6th P.M. The Lost Creek Project is considered the core project, with current production occurring in Mine Unit 1. The other five Projects, collectively referred to as the Adjoining Projects, are extension and exploration properties targeted as possible sources of additional feed to the Lost Creek Project production facilities. All Projects within the Property consist mostly or entirely of federal unpatented lode mining claims. Three of the Projects also have state mineral leases. URE does not hold any private (fee) mineral leases within the Lost Creek Property. Land holdings within the six projects within the Property are summarized below.
Lost Creek Project: is located in Sections 13, 24 and 25 of T25N, R93W, and Sections 16 through 20 and portions of 29 through 31 of T25N, R92W, (Figure 3a). It is approximately 4,194 acres in size.
Adjoining Company Projects:
LC East Project: is a block of federal mineral claims (Figure 3b) which are adjoining to the east and northeast of the Lost Creek Project, within Sections 1 through 3, 10 through 15, 20 through 24, 27 through 29 of T25N, R92W. The LC East Project encompasses approximately 4,780 acres.
LC North Project: is adjoining to the north and west of the Lost Creek Project in Sections 4 through 9, 17, and 18 of T25N, R92W, Sections 1, 11 through 15, 22, 23, 26, and 27 of T25N, R93W and Sections 32 through 34 of T26N, R92W (Figure 3c). The LC North Project currently encompasses approximately 7,489 acres.
LC South Project: is adjoining to the south and east of the Lost Creek Project in Sections 22 through 35 of T25N, R92W, Sections 3 through 6, and 8 through 11, 14, and 15 of T24N, R92W, and Section 1 of T24N, R93W (Figure 3d). The LC South Project encompasses approximately 11,467 acres.
LC West Project: consists of a block of mining claims plus one state lease in two parcels (Figure 3e). Most of LC West adjoins the Lost Creek, LC North and LC South Projects within Sections 16, 21, 22, 25 through 28, 33 through 36 of T25N, R93W, and Sections 2 through 5 of T24N, R93W. One of the state mineral lease parcels lies as a disconnected outlier from the main body of the LC West Project. The LC West Project encompasses a total of approximately 3,840 acres.
EN Project: is adjoining to the east of the LC South Project in Sections 16 through 22 and Sections 27 through 34 of T25N, R91W, Sections 5 through 7 of T24N, R91W, Sections 25, 35 and 36 of T25N, R92W, and Sections 1 through 3 and 10 through 12 of T24N, R92W (see Figure 3f). Included in this are two state mineral leases in Section 16, T25N, R91W and Sect. 36, T25N, R92W. The current EN Project encompasses approximately 10,122 acres, including 8,842 acres comprised of federal unpatented lode mining claims and 1,280 acres in two state of Wyoming mineral leases
| 11 |
| 4.2 | Mining Claims, Mineral Leases and Surface Use Agreements |
The Lost Creek Property currently consists of a total of 2,106 federal unpatented lode mining claims and four state of Wyoming leases for uranium and associated minerals. The land status of each project is illustrated in Figures 3a-f and described below:
Lost Creek Project: 201 federal unpatented lode mining claims and one state of Wyoming mineral lease (Figure 3a).
LC East Project: 268 federal unpatented lode mining claims (Figure 3b)
LC North Project: 403 federal unpatented lode mining claims (Figure 3c). 78 claims were relinquished in August 2012.
LC South Project: 625 federal unpatented lode mining claims (Figure 3d).
LC West Project: 142 federal unpatented lode mining claims and one state of Wyoming mineral lease (in two parcels, Figure 3e).
EN Project: 467 federal unpatented lode mining claims and two state of Wyoming mineral leases. (Figure 3f).
The surface of all the mining claims is controlled by the BLM, with URE possessing the right to use as much of the surface as is necessary for exploration and mining of the claims, subject to compliance with all federal, state and local laws and regulations. Surface use on BLM lands is administered under federal regulations.
Likewise, access to state controlled land is largely inherent within the state of Wyoming mineral lease. The state lease within the Lost Creek Project requires a nominal surface impact fee to be paid. The other state mineral leases currently do not have surface impact payment obligations. A Temporary Use Permit is in place allowing for the use and maintenance of an improved road on the leased state section within the Lost Creek Project.
| 4.3 | Title to Property |
URE, through its wholly-owned subsidiaries Lost Creek ISR, LLC and NFU Wyoming, LLC controls the federal unpatented lode mining claims and state of Wyoming mineral leases which comprise the Property. Currently, NFU Wyoming, LLC controls the mining claims and state leases at the EN Project. Lost Creek ISR, LLC controls the lands at the other five projects within the Property. Title to the mining claims is subject to rights of pedis possessio against all third-party claimants as long as the claims are maintained. The mining claims do not have an expiration date. Affidavits have been timely filed with the BLM and recorded with the Sweetwater County Recorder attesting to the payment of annual maintenance fees to the BLM as established by law from time to time. The state leases have a ten-year term, subject to renewal for successive ten-year terms. From time to time, formal mineral title reports are prepared for URE by mineral title attorneys (Section 3.0).
| 4.4 | Property Boundaries |
A professional legal survey of the permit area boundary of the Lost Creek Project was completed in advance of the submission of applications for permits and licenses on the Project. Similarly, a professional legal survey was conducted for the anticipated permit area for the LC East permit amendments. Legal surveys of individual mining claims are not required, and otherwise have not been completed. The area covered by the state leases is based on the legal subdivision descriptions as set forth by the U.S. Cadastral Survey and have not been verified by legal surveys.
| 12 |
| 4.5 | Royalties, Taxes and Fees |
URE is required to pay various state and local taxes related to production and the ownership of property. These taxes are in the form of severance, ad valorem, gross products, personal, and real property taxes. There is no state income tax in Wyoming. Royalties based on sales of uranium will be paid to the state under the state mineral lease at the Project. The state mineral leases carry the standard 5% royalty required by law. In April, 2013 URE removed the only privately held royalty interest which had pertained to the Lost Creek Project by means of an agreement for the purchase of that royalty interest. Various royalties exist on portions of the Adjoining Projects. Additionally, maintenance fees will be paid to the BLM, and payments made to the state for the state leases.
The Lost Creek Property analysis includes tax estimates for state severance taxes, county ad valorem taxes and property taxes, all of which are directly attributable to the Property. Federal income tax is excluded. Ur-Energy USA Inc. files consolidated federal tax returns in the United States and had approximately $59.2 million in tax loss carry forwards as of December 31, 2012. The Company does not anticipate paying federal income taxes until the existing, and any future, tax loss carry forwards are utilized. In addition, reclamation costs can be deducted in the early years of the project, thus also pushing out the tax liability. Estimating federal income taxes for the Lost Creek Property therefore becomes speculative and, as a result, has not been included in this Preliminary Economic Analysis. These costs are discussed in more detail in Section 22.0.
| 4.6 | Environmental Liabilities |
There were no pre-existing mineral processing facilities or related tailings ponds or waste deposits within the Property prior to the initiation of the construction of Lost Creek’s ISR facilities and wellfields. Surface disturbance at the LC Project is associated with drilling, well installation, wellfield construction, plant construction and installation of the two deep waste disposal wells. Subsurface disturbance is associated with the injection and production operations in the first Mine Unit. Other than the above mentioned, there are no known environmental liabilities on the Property. The total bond held by the WDEQ to reclaim all Property disturbances for which URE is liable is $9.89 million as of August 31, 2013 of which $8.6 million is for the Lost Creek Project. The total anticipated bond for the life of Property is $20.0 million. This is equivalent to the anticipated costs for complete restoration and reclamation of the site over the life of mine.
| 4.7 | Permitting |
The NRC has granted a Source and Byproduct Materials License to recover uranium from the HJ Horizon at the Lost Creek Project. Likewise, the WDEQ has finalized its permitting process and issued a Permit to Mine to recover uranium from the HJ Horizon; including approval of the Mine Unit 1 Data Package. The BLM has issued a Record of Decision regarding its EIS toward approval of the Plan of Operations for the project. Accordingly, all permits required to operate the Lost Creek Mine are in place and include the following:
| · | The BLM issued a Record of Decision on October 5, 2012. |
| · | The NRC issued a Source and Byproduct Material License SUA-1598 on August 17, 2011. The NRC subsequently performed pre-operational inspections and granted permission to begin mining on August 2, 2013 and permission to utilize the yellowcake dryer on October 3, 2013. |
| 13 |
| · | The WDEQ has issued several permits including: |
| o | Permit 788, which includes an aquifer exemption for the three Lost Creek HJ mine units and approval to begin injection in Mine Unit 1, was granted on October 21, 2011. A hydrologic package must be submitted for review and approval for each subsequent Mine Unit. Permit 788 was granted after consultation with the Wyoming Department of Game and Fish and the U.S. Fish and Wildlife Service. Special consideration was given to sage grouse protection. |
| o | Air Quality Permit CGT-13201 was issued on May 18, 2012. |
| o | Storm Water Discharge Permit WYR103695 was approved on June 17, 2011 and includes the LC East and Lost Creek Projects. |
| o | Class I UIC Permit 09-586, granting permission to install up to five deep disposal wells, was granted on May 28, 2010. An aquifer exemption for deep well #4 was subsequently granted on December 13, 2013. Additional aquifer exemptions may be required if other deep wells are drilled and encounter water quality less than 10,000 mg/l total dissolved solids. An aquifer exemption was not required for deep well #1 since the water contains greater than 10,000 mg/l total dissolved solids. |
| · | The two facility holding ponds were approved by EPA Permit 8P-AR on December 20, 2011 and by State Engineer Permit 13595R on May 28, 2010. |
| · | Sweetwater County rezoned the land per Resolution 08-03-ZO-07 on March 4, 2008. The County later approved the Development Plan on December 1, 2009. Septic Permit 11-082 was issued on April 14, 2011. The county has also signed a Road Maintenance Agreement allowing the company to remove snow from local County roads as needed. |
| · | Numerous well installation permits have been applied for and received through the State Engineer’s Office. Additional permits will be sought as needed. |
The following permits will be required before beginning mining at LC East and within the KM Horizon at Lost Creek. The Company expects to begin submitting these applications in the first quarter of 2014:
| · | The BLM must review and approve an application for mining at the LC East Project and within the KM Horizon at the Lost Creek Project after a National Environmental Policy Act (NEPA) review. It is anticipated that the NRC will participate in this review as a cooperating agency. Upon receipt of the application, the BLM will determine whether to perform an Environmental Assessment or an Environmental Impact Statement. |
| · | A Permit amendment requesting approval to mine at the LC East Project and within the KM Horizon at the Lost Creek Project must be submitted to the WDEQ for review and approval. Approval will include an aquifer exemption. |
| · | The air quality permit will be revised to account for additional surface disturbance. |
| · | An application will be submitted to Sweetwater County to re-zone the land at LC East. A subsequent Development Plan will also have to be submitted for review and approval. |
| · | Numerous well permits from the State Engineer’s Office will be required. |
Exploration activities on the Adjoining Projects are carried out under Drill Notices issued by the WDEQ and Notices of Operations issued by the BLM. These permits are obtained and managed as necessary to continue exploration work.
| 14 |
| 4.8 | Other Relevant Factors |
The Lost Creek plant (Figures 2 and 11) has been constructed and is operational. Production well installation in Mine Unit 1 is near completion and Header Houses 1, 2 and 3 are operational. A second deep disposal well (LC DW #4) has been drilled and tested near the plant site. The plant and associated access roads have been constructed as shown on Figure 2. URE has also installed numerous monitoring and other wells in support of its permit and license applications and to further its mine planning. Various other infrastructure, including wells, water tanks, a meteorological station, and other equipment, has been placed on the Property by URE in support of its mining, development, exploration, and permit/license activities.
| 5.0 | Accessibility, Climate, Local Resources, Infrastructure and Physiography |
| 5.1 | Topography, Elevation and Vegetation |
The Property is located near the northeastern part of the Great Divide Basin (GDB) and occurs at an elevation of approximately 7,000 ft. above mean sea level. The GDB is an oval-shaped structural depression encompassing some 3,500 square miles in south-central Wyoming. The basin is bounded on the north by the Wind River Range and Granite Mountains, on the east by the Rawlins Uplift, on the south by the Wamsutter Arch, and on the west by the Rock Springs Uplift.
Most of the Property consists of flat upland areas and gentle south facing slopes that are dissected by southerly-flowing ephemeral washes. There are no perennial streams on the Property. The vegetation on the Property is dominated by sagebrush (Artemisia tridentata) which occurs throughout both upland and lowland environmental settings. Sagebrush is well adapted to the cold winter temperatures and limited precipitation that characterize the Property. Other vegetation identified at the Property includes native cool season perennial grasses, perennial forbs, cushion plants, semi-shrubs, cacti, shrubs and lichens.
| 5.2 | Access |
Regional access to the Property relies almost exclusively on existing public roads and highways. The local and regional transportation network relevant to the Property consists of primary, secondary, local and unimproved roads (Figures 1 and 2). Direct access to the Property relies mainly on two crown-and-ditched gravel paved access roads to the processing plant. One enters from the west off of Sweetwater County Road 23N (Wamsutter-Crooks Gap Road). The other enters from the east off of BLM Sooner Road. In addition to the designated routes, there are a number of four-wheel-drive “two-track” roads that traverse the area for recreation and grazing access, as well as various other uses, including mineral exploration. On a wider basis, from population centers, the Property area is served by an Interstate Highway (Interstate 80), a US Highway (US 287), Wyoming state routes (SR 220 and 73 to Bairoil), local county roads, and BLM roads.
| 5.3 | Proximity to Population Centers |
The Property is located in a remote area. The nearest town, Bairoil, with a population of less than 100, is about 15 miles northeast of the Property. The Wyoming towns of Rawlins, Rock Springs and Casper are approximately 36, 82 and 90 miles from the Property, respectively. Figure 1 shows the locations of population centers with respect to the Property.
| 15 |
Sweetwater County, in which the Property is located, had a population of 43,806 in 2010. This represents a 16.5% increase in Sweetwater County’s population since the 2000 census (U.S. Census Bureau 2010 Report on Sweetwater County, WY). Sweetwater County has a population density of 4.2 people per square mile. Carbon County, which is south of the Property, had a population of 15,885 in 2010 which was primarily located in the town of Rawlins. This represents a 1.6% increase in Carbon County’s population since the 2000 census (U.S. Census Bureau 2010 Report on Carbon County, WY).
Personnel required for management, construction and operation are drawn from the nearby towns of Rawlins, Bairoil, Jeffrey City, Lander, Riverton and Casper, Wyoming.
| 5.4 | Climate and Operating Season |
The Property is located in the intermountain semi-desert eco-region (Curtis and Grimes, 2004), which has cold winters and short, hot summers (Bailey, 1995). The average annual temperatures range from 40 to 52 degrees Fahrenheit. The average annual precipitation ranges from five to 14 inches (Bailey, 1995). The nearest relatively large bodies of water are the Pathfinder and Seminoe Reservoirs, which are unlikely to affect local climatic conditions because they are approximately 50 miles downwind of the Property. Winter weather may limit the time periods for certain portions of wellfield drilling and construction at the Lost Creek Project, but should not significantly affect the operation of an ISR facility. ISR operations at the Lost Creek Project will be conducted year-round. Winter conditions will continue to affect exploration and drilling on the Property.
The state of Wyoming has developed a Core Area Strategy to help protect the Greater Sage Grouse species within certain core areas of Wyoming. Exploration areas of the Property are all within the Greater South Pass core area and are thus subject to work activity restrictions from March 1 to July 15 of each year. The timing restriction precludes exploration drilling and other non-operational based activities which may disturb the sage grouse. Drilling activity is not restricted outside this period.
The sage grouse timing restrictions relevant to ISR production activities at the Lost Creek Project are somewhat different because the state of Wyoming has recognized that mining projects within core areas must be allowed to operate year-round. Therefore, since construction at the Lost Creek Project began, there have been no timing restrictions on drilling, construction, or operational activities within pre-approved disturbed areas as shown in the Permit to Mine. These disturbed areas include the processing plant, holding ponds, roads, power lines, wellfields, and deep disposal wells. Any exploration drilling within the Property but outside the pre-defined disturbed area of the Permit to Mine will continue to be subject to sage grouse timing restrictions.
The Core Area Strategy also places limitations on the amount of disturbance within an area. These restrictions are sufficiently flexible that it is very unlikely they will ever limit exploration drilling. For the Property, there is a five percent cap on anthropogenic disturbance in the area. An analysis of the planned disturbance on the Lost Creek Project revealed that the disturbance total will be about 0.9%, far below the five percent limit. The Wyoming Game and Fish Department has also approved the Lost Creek Sage Grouse Protection Plan.
| 5.5 | Property Infrastructure |
As described in Sections 4.2 and 4.3, URE has secured sufficient surface access rights for development of the Property.
| 16 |
The basic infrastructure (power, water, and transportation) necessary to support an ISR mining operation is located within reasonable proximity of the Property. Generally, the proximity of the Property to paved roads is beneficial with respect to transportation of equipment, supplies, personnel and product to and from the Property. Existing regional overhead electrical service is aligned in a north-to-south direction along the western boundary of the Lost Creek Project. A new overhead raptor resistant power line, approximately 2 miles in length, was constructed to bring power from the existing Pacific Power line to the Lost Creek plant. Power drops have been made to the Property and distributed to the plant, offices, wellfields, and other facilities.
Previous infrastructure near the Property is predominantly related to oil and gas development, past and present uranium exploration and beneficiation, and recreation. There have been several conventional uranium mills and mines and an ISR project in the vicinity of the Property (Figure 2). The closest mining facility to the Property is the Sweetwater Mill, a conventional uranium mine and mill that is not currently operational. The facility lies about three and one-half miles south of the southwestern-most boundary of URE’s Lost Creek Project, with less than one mile separating the respective permit boundaries.
Mine operations require disposal into deep disposal wells (DDWs) of limited quantities of fluids that cannot be returned to the production aquifers. A total of five DDWs have been permitted for the Project while only three are expected to be needed (Figure 11). Two have been drilled to date. Two storage ponds, permitted by state and federal regulators, are located adjacent to the plant and are used to temporarily store the water that will ultimately be disposed of in the DDWs. The first DDW (LC DW #1) is located in the extreme southwest corner of the Lost Creek Project. It was installed and tested in 2008, and was used as the basis for permitting the other four wells. The second DDW (LC DW #4) was drilled in late 2012 immediately south of the plant building. The location of the other three planned DDWs are, (1) SW quarter of Section 13 of T25N R93W, (2) SE quarter of Section 19 of T25N R92W, and (3) the SE quarter of Section 17 of T25N R92W.
Tailings storage areas, waste disposal areas, and heap leach pad(s) will not be a part of the infrastructure for the Project as ISR operations do not require these types of facilities.
| 5.6 | Water Supply |
Most of the non-potable water for ISR operations is obtained from the mining operation itself; i.e., from extracted groundwater. With the exception of a ½ % to 1½ % bleed, the groundwater extracted by the production wells will be continuously recycled through the system.
Water for activities within the Property
is currently supplied by eleven water wells drilled by URE. Eight of these are located within the Lost Creek Project, one is in
the LC North Project, one is in the LC South Project, and one is in the EN Project. All but one of these wells produces water in
excess of 25 gallons per minute. Water usage in the past has been mostly for drilling, casing wells, and abandonment of exploration
and delineation holes. Two of the seven wells in the Lost Creek Project are adjacent to the plant site. One of those is being used
as a source of fire suppression water and the other as a source of fresh water for that facility. Additional wells may be necessary
as exploration and production activities extend further from the plant.
| 6.0 | History |
| 6.1 | Ownership History of the Lost Creek Property |
Uranium was discovered in the GDB in 1936. Exploration activity increased in the early 1950s after the Gas Hills District discoveries, and continued to increase in the 1960s, with the discovery of numerous additional occurrences of uranium. Wolf Land and Exploration (a private corporation which later went public as Inexco), Climax (Amax) and Conoco Minerals were the earliest operators in the Lost Creek area and made the initial discoveries of low-grade uranium mineralization in the Battle Spring Formation in 1968. Kerr-McGee, Humble Oil, and Valley Development, Inc. were also active early in the area.
| 17 |
Lost Creek Project – Ownership History
Drilling within the current Lost Creek Project area during the period from 1966 to 1976 consisted of approximately 115 wide-spaced exploration holes by several companies including Conoco, Climax (Amax), and Inexco.
Texasgulf acquired the western half of what is now the Lost Creek Project in 1976 through a joint venture with Climax and made the initial identification of what is now referred to as the Main Mineral Trend (MMT). In 1978 Texasgulf optioned into a 50% interest in the adjoining Conoco ground to the east and continued drilling, fully identifying the MMT eastward to the current Project boundary. During this period Texasgulf drilled approximately 412 exploration holes within what is now the Lost Creek Project. This included 12 monitor wells and 16 core holes. During this period Minerals Exploration Company (a subsidiary of Union Oil Company of California) also drilled approximately 8 exploration holes in what is currently the western portion of the Lost Creek Project. Texasgulf dropped the project in 1983 due to declining market conditions. The ground was subsequently picked up by Cherokee Exploration, Inc. which conducted no field activities.
In 1987, Power Nuclear Corporation (also known as PNC Exploration) acquired 100% interest in the project from Cherokee Exploration, Inc. PNC Exploration carried out a limited exploration program as well as geologic investigations and an evaluation of previous in situ leach testing by Texasgulf. PNC Exploration drilled a total of 36 holes within the current Project boundary, including one core hole.
In 2000, New Frontiers Uranium, LLC acquired the property and the database from PNC Exploration, but conducted no drilling or geologic studies. New Frontiers Uranium, LLC later transferred the Lost Creek Project-area property along with its other Wyoming properties to its successor NFU Wyoming, LLC.
In June 2005, Ur-Energy USA Inc., a wholly-owned subsidiary of URE, purchased 100% ownership of NFU Wyoming, LLC. Within the first year of ownership, the Company initiated drilling, and preparations for mining permit applications. Toward that goal, it conducted engineering studies, core drilling for metallurgical studies, and delineation drilling to outline and define the uranium resources. In addition, comprehensive baseline studies were initiated, including installation of additional monitor wells for hydrological testing and water-quality sampling and a meteorological station within the Project area.
In July 2007, NFU Wyoming, LLC transferred the Lost Creek Project to Lost Creek ISR, LLC, a wholly-owned subsidiary of Ur-Energy USA Inc. formed for the purpose of owning and developing the Project through the permitting process and into operations as an ISR mine. In 2012 the LC East Project was transferred into Lost Creek ISR, LLC. The LC South, LC West and LC North Projects were also transferred to Lost Creek ISR, LLC in 2013.
| 18 |
Adjoining Projects – Ownership History
The Adjoining Projects share a history of ownership history similar to that of the Lost Creek Project because over the years they were operated by many of the same companies which maintained large property holdings in the vicinity. The Adjoining Projects have been acquired since 2006 through the location of federal unpatented lode mining claims, through purchase agreements made with individuals and companies, and through leases with the state of Wyoming. As discussed in the April 30, 2012 PEA, the latest additions have been through the Asset Exchange Agreement (AEA) with Uranium One Americas, Inc. (U1) in February 2012 and with staking the “New Claims” in 2011 and 2012. The individual Projects originally were stand-alone exploration projects, but expanded over time such that now, along with the Lost Creek Project, they collectively represent a contiguous block of land referred to as the Lost Creek Property. The Company currently holds 37,698 acres within the Adjoining Projects in addition to the 4,194 acres of the Lost Creek Project (Figures 1 and 2).
LC East:
LC East is a relatively new Project drawn in part from two large blocks of claims (RD and PN claims) obtained in 2012 with the AEA, plus some of the New Claims staked in 2011 and 2012 by URE.
Similar to the other projects, the earliest historical ownership within what is now the LC East Project was by Wolf Land and Exploration starting in 1967. In 1969 Conoco entered into a joint venture with Wolf Land and Exploration, with Conoco acting as the operator. The next year Conoco took over the project and continued to explore the area as part of its Project A. In 1978 Texasgulf continued the activity as the operator of Project A in a joint venture with Conoco until 1983. PNC Exploration later acquired some of the ground in 1987 and held it until 2000.
With the resurgence of the uranium industry, High Plains Uranium, Inc. (HPU) and Energy Metals Corp. (EMC) both staked claims within the current Project boundaries in 2004. The HPU controlled claims subsequently went to EMC in 2007 when that company acquired HPU. Later that year EMC was in turn taken over by U1. U1 maintained the claims until they were acquired by URE on February 27, 2012 via the AEA. The land obtained from U1 represents the majority of the new LC East Project.
During 2011-2012, an additional 142 of the New Claims were staked by URE and subsequently joined to the LC East Project to cover prospective areas near and adjacent to the lands acquired from U1. The LC East Project currently consists of 268 claims in 4,780 acres (see Figure 3b). No changes in the LC East land position have been made since the April 30, 2012 PEA.
LC North:
Early historic ownership of claims within what is now the LC North Project began in 1967 and continued into the mid-1970s. Activity was dominated by Conoco, at times in a joint venture with Inexco. Climax also held property in the late 1960s but to a much lesser extent. In the mid to late 1970s Texasgulf continued as the primary operator until 1983 when they discontinued operations in the GDB.
Initial claim staking by URE in the LC North Project commenced in early 2007 when it was recognized that the mineral trends in the Lost Creek Project likely continue to the north. In late 2007, additional claims were staked west and northwest of the Lost Creek Project to cover ground where it appears probable that the MMT continues beyond the Lost Creek Project boundary. In early 2012, 17 claims were added to the Project, having been obtained as part of the AEA. Also four claims located along the western edge of Section 15, T25N, R92W were re-allocated from LC North to the newly designated LC East Project. In August 2012 78 claims in the northwest quadrant of the Project were dropped. The LC North Project currently consists of 403 claims covering approximately 7,489 acres (Figure 3c).
| 19 |
LC South:
Wolf Land and Exploration was the earliest operator within what is now the LC South Project and was active from 1967 to 1968. Conoco then became the dominant operator through the mid-1970s, exploring the ground as part of their Project A. They were replaced by Texasgulf in 1978 when it took over operatorship of the Project A joint venture until 1983.
Acquisition by URE of the LC South Project started in 2007. The Project’s land position was expanded to a total of 300 claims by the end of 2008. In 2009, blocks of additional claims adjacent and to the east were acquired from private parties and added to the LC South Project. These acquisitions were followed by the staking of several claims to fill the gaps between the LC South and the EN Projects. Eight of the New Claims were added to the Project in 2012 to complete the gap-filling activities. Currently, the LC South Project consists of 625 claims covering 11,467 acres (Figure 3d). No changes in the LC South land position have been made since the April 30, 2012 PEA.
LC West:
This is also a relatively new Project which was created from portions of the AEA and New Claims. The earliest known operator on this ground was Wolf Land and Exploration who drilled only a few holes in 1967. Conoco controlled most of the ground in the early 1970s within its Project A and was later succeeded by Texasgulf in the mid-1970s to early 1980s when they took control of the Project A joint venture. Minerals Exploration Corporation also held portions of this ground in the early 1970s as part of their Sweetwater exploration activities. Acquisition by URE via the AEA provided 36 DB claims plus one state lease in two parcels (Figure 3e). The contribution of New Claims consisted of 106 LCW claims staked during 2011-2012. Total land holdings in the LC West Project are currently 142 claims in 2,800 acres plus 1,040 acres in one state mineral lease. No changes in the LC West land position have been made since the April 30, 2012 PEA.
EN:
The earliest operator in the EN area was Wolf Land and Exploration which held portions of the current EN ground in the late 1960s. Humble (Exxon) also controlled portions of the land through 1970. Conoco entered into a joint venture with Wolf in 1969 and eventually assumed full control through 1974 as part of their Project A. Other operators who held portions of the ground during the 1970s include Teton Exploration, Kerr-McGee, and Climax (Amax). The last historical operator was Texasgulf who held property in the late 1970s.
URE’s original land position of the EN Project began with the acquisition of 172 claims from a private party in 2006. This was augmented in 2007 with the staking of an additional 295 claims by NFU Wyoming, LLC following an evaluation of new and historical data in the vicinity. Additionally, in 2007 one state mineral lease (640 acres) was acquired. With the AEA, an additional state mineral lease (Section 16, T25N, R91W) was added to the Project to bring the current land position to a total of 467 claims covering 8,842 acres plus two state leases, covering 1,280 acres. Total acreage is 10,122 (Figure 3f). No changes in the EN land position have been made since the April 30, 2012 PEA.
| 6.2 | Exploration History |
This section presents a summary of the history and extent of exploration for uranium on the Lost Creek Property prior to acquisition by URE. No significant uranium development work had been done within the Property by any operators previous to URE.
| 20 |
Exploration Summary of the Lost Creek Area
Significant uranium exploration within the area which currently comprises the Lost Creek Property began in the mid-1960s. In the late 1960s several companies conducted early regional drilling operations, including Climax (Amax), Wolf Land and Exploration (Inexco), Humble Oil (Exxon) and Conoco Minerals. By the mid-1970s the land holdings in the area were concentrated largely between Texasgulf and Conoco Minerals.
Wolf Land and Exploration dominated the scene in the late 1960s and drilled hundreds of relatively wide-spaced exploration holes throughout the area that is now designated as the Lost Creek Property. They later went public as Inexco and entered into a joint venture with Conoco in 1969 to continue exploring the region. Conoco gained sole control of the properties in 1970 and continued to explore their large land position in the region which they operated as “Project A.” In doing so, they identified the eastern half of what is now referred to as the MMT in the Lost Creek Project and also what is herein denoted as the EMT in the LC East Project. Project A also included large portions of what are now the LC North, LC South and EN Projects.
Climax (Amax) held claims west of Conoco’s “Project A” but conducted only cursory exploration on them during the early 1970s. Texasgulf entered into a joint venture with Valley Development, Inc. in 1976 and initiated a major exploration program which resulted in the identification of the western half of the MMT. In 1978 Texasgulf joined with Conoco as operator in a joint venture to continue exploring the MMT and Project A. Texasgulf continued with extensive exploration efforts and by the early 1980s had fully identified the MMT and portions of the EMT. They subsequently dropped the property in 1983 due to the declining uranium market.
In 1981 Minerals Exploration Company drilled approximately 8 exploration holes in what is currently the western portion of the Lost Creek Project. PNC Exploration acquired the ground covering the MMT and portions of Project A in 1987. They carried-out limited in-fill exploration drilling and geological evaluations until 1996 before selling the property in 2000. No other exploration activities were conducted on the Property until acquisition by URE in 2005.
URE is in possession of virtually all of the known historical drilling data, maps and reports from Conoco, Texasgulf and PNC Exploration activities. This includes:
Geophysical logs (including gamma logs),
Cutting sample and core descriptions for most holes,
Mineralization intercept databases,
Location maps and drill location coordinates,
Geological interpretation maps,
Geological and resource estimation reports,
Metallurgical reports, and
Chemical analyses.
Lost Creek Project: Exploration Summary
| Pre-1976: | Numerous companies held the property, or portions of the property. |
Initial significant uranium mineralization was discovered by Climax Uranium (Amax) and Conoco in 1968. 115 wide-spaced holes drilled (combined)
| 21 |
| 1976: | Texasgulf optioned property from Valley Development, Inc. 37 exploration holes drilled (west half of current Project area). |
| 1977: | Texasgulf identified the MMT in the west portion of the current Project area: 129 exploration holes drilled. |
| 1978: | Texasgulf obtained a 50% interest in the Conoco claims on trend to the east. Continued exploration drilling: 150 holes drilled. |
| 1979: | Texasgulf exercised its option with Valley Development: 17 exploration holes drilled. Leach testing was done, aimed at conventional mining. |
| 1980-1982: | Texasgulf continued to define the MMT: 79 exploration holes drilled, including 12 pump-test monitor wells. Leach tests were conducted by Wyoming Minerals Corporation on behalf of Texasgulf. (The results were later deemed of limited usefulness for ISR planning in a scoping evaluation by SKM Associates for Strathmore Resources [SKM, 1997]). |
| 1981: | Minerals Exploration Company drilled approximately 8 exploration holes in the western portions of the Lost Creek Project. |
| 1983-1986: | No exploration drilling activity. |
| 1987: | PNC Exploration acquired the properties. |
| 1987-1992: | PNC Exploration drilled 57 exploration holes in the area, including 36 within the current Project boundary and one core hole. |
| 1992-1999: | No exploration drilling activity. |
| 2000: | PNC Exploration sold the properties to New Frontiers Uranium, LLC. |
| 2000-2005: | No exploration drilling activity. |
| 2005: | URE acquired the Lost Creek Project. |
At the time URE acquired the Project in 2005, a total of 559 exploration holes and 12 pump-test wells had been drilled (Table 4). The pump-test wells were subsequently plugged and abandoned prior to acquisition by URE. The MMT was well identified and drilled-out to varying degrees of confidence. In general, drill spacing at that time was approximately:
| 20% | spacing 100 ft. or less | |
| 50% | spacing roughly 200 ft. | |
| 30% | spacing 400 ft. or greater |
| 22 |
Table 4: Drill Hole Summary - Historic and Recent
| LOST CREEK PROJECT | ||||||||||||||||||||||||||
| YEAR | PLUG HOLES | WELLS | TOTAL | [CORED]* | ||||||||||||||||||||||
| EXPLORATION | DELINEATION | PILOTED & NOT CASED (PNC) |
MONITOR/PUMP TEST WELLS |
WATER WELLS |
PRODUCTION PATTERN WELLS |
# HOLES | FEET | |||||||||||||||||||
| Historic Holes: | 559 | 12 | 571 | 367,983 | [17] | |||||||||||||||||||||
| (Historical Wells Abandoned)* | (12)* | |||||||||||||||||||||||||
| 2005 | 14 | 1 | 15 | 10,880 | [9] | |||||||||||||||||||||
| 2006 | 17 | 17 | 7,364 | |||||||||||||||||||||||
| 2007 | 6 | 189 | 60 | 2 | 257 | 156,722 | [4] | |||||||||||||||||||
| 2008 | 97 | 300 | 60 | 2 | 459 | 303,881 | [3] | |||||||||||||||||||
| 2009 | 238 | 19 | 257 | 180,476 | ||||||||||||||||||||||
| 2010 | 6 | 84 | 9 | 99 | 71,388 | [1] | ||||||||||||||||||||
| 2011 | 50 | 6 | 21 | 77 | 58,430 | [6] | ||||||||||||||||||||
| 2012 | 95 | 31 | 3 | 190 | 319 | 166,760 | ||||||||||||||||||||
| **2013 | 48 | 91 | 104 | 1 | 724 | 968 | 457,869 | [2] | ||||||||||||||||||
| URE Totals: | 159 | 974 | 122 | 290 | 9 | 914 | 2,468 | 1,413,770 | [25] | |||||||||||||||||
| (URE Wells Abandoned)* | (23)* | (1)* | (30)* | |||||||||||||||||||||||
| Drill Hole Totals: | 3,039 | 1,781,753 | [42] | |||||||||||||||||||||||
| LC EAST PROJECT | ||||||||||||||||||||||||||
| Historical Holes: | 885 | 178 | 1 | 1064 | 474,582 | [16] | ||||||||||||||||||||
| 2012 | 16 | 164 | 27 | 207 | 125,170 | |||||||||||||||||||||
| **2013 | 4 | 4 | 2,235 | |||||||||||||||||||||||
| URE Totals: | 16 | 164 | 31 | 211 | 127,405 | [0] | ||||||||||||||||||||
| (URE Wells Abandoned)* | (5)* | |||||||||||||||||||||||||
| Drill Hole Totals: | 1,275 | 601,987 | [16] | |||||||||||||||||||||||
| LC NORTH PROJECT | ||||||||||||||||||||||||||
| Historical Holes: | 174 | 174 | 116,147 | [0] | ||||||||||||||||||||||
| 2007 | 30 | 30 | 35,403 | |||||||||||||||||||||||
| 2011 | 101 | 1 | 102 | 97,052 | ||||||||||||||||||||||
| URE Totals: | 131 | 1 | 132 | 132,455 | [0] | |||||||||||||||||||||
| Drill Hole Totals: | 306 | 248,602 | [0] | |||||||||||||||||||||||
| LC SOUTH PROJECT | ||||||||||||||||||||||||||
| Historic Holes: | 486 | 486 | 228,414 | [1] | ||||||||||||||||||||||
| 2010 | 159 | 159 | 101,111 | |||||||||||||||||||||||
| 2012 | 1 | 1 | 800 | |||||||||||||||||||||||
| URE Totals: | 159 | 1 | 160 | 101,911 | [0] | |||||||||||||||||||||
| Drill Hole Totals: | 646 | 330,325 | [1] | |||||||||||||||||||||||
| LC WEST PROJECT | ||||||||||||||||||||||||||
| Historical Holes: | 68 | 68 | 44,564 | [0] | ||||||||||||||||||||||
| Drill Hole Totals: | 68 | 44,564 | [0] | |||||||||||||||||||||||
| EN PROJECT | ||||||||||||||||||||||||||
| Historical Holes: | 67 | 67 | 55,872 | [0] | ||||||||||||||||||||||
| 2007 | 3 | 3 | 8,590 | |||||||||||||||||||||||
| 2008 | 11 | 1 | 12 | 11,389 | ||||||||||||||||||||||
| URE Totals: | 14 | 1 | 15 | 19,979 | [0] | |||||||||||||||||||||
| Drill Hole Totals: | 82 | 75,851 | [0] | |||||||||||||||||||||||
| GRAND TOTALS - LOST CREEK PROPERTY [All Projects] | ||||||||||||||||||||||||||
| PLUG HOLES | WELLS | TOTAL | [CORED]* | |||||||||||||||||||||||
| EXPLORATION | DELINEATION | PILOTED & NOT CASED (PNC) |
MONITOR/PUMP TEST WELLS |
WATER WELLS |
PRODUCTION
PATTERN WELLS |
# HOLES | FEET | |||||||||||||||||||
| HISTORICAL HOLES | 2,239 | 178 | 12 | 1 | 2,430 | 1,287,562 | [34] | |||||||||||||||||||
| UR-ENERGY | 479 | 1,138 | 122 | 321 | 12 | 914 | 2,986 | 1,795,520 | [25] | |||||||||||||||||
Note: Footages from drilling the two deep disposal wells for the Lost Creek Project are not included with these figures.
* Cored holes and abandoned wells are secondary categories and are counted within other categories
** Drill hole counts and footage are through August 31th, 2013
These exploration drill results, in addition to 14 confirmation holes drilled by URE in 2005, comprised the database for the 2006 NI 43-101 resource estimate for the Project by Roscoe-Postle & Associates (RPA, 2006).
| 23 |
No development work was conducted on the Project by operators previous to URE. Minor exceptions to this are the 12 pump-test monitor wells installed by Texasgulf in 1982 and leach testing of core samples in 1979 and 1981.
No exploration by URE at the Lost Creek Project has been conducted since the April 30, 2012 PEA.
LC East Project: Exploration Summary
The ground currently designated as the LC East Project has been extensively drilled in the past and can be considered to be in the mid to late exploration in the northern portions to pre-development in the southern portions. The earliest drilling was started in 1967 by Wolf Land and Exploration who was later joined in a joint venture by Conoco in 1969. Also, in 1967 Hecla Mining drilled one exploration hole on what is currently the LC East Project. Conoco took full control of the venture in 1970 and continued to drill the property through 1977 as part of its Project A. By that time approximately 916 exploration holes had been drilled, including 13 core holes. Abundant significant mineral (exceeding URE’s definition of “ore-quality”: GT ≥ 0.30, grade ≥ 0.020% eU3O8, see Section 14.2) had been found and a well-defined mineral trend identified, which is currently referred to as the EMT. Much of the drilling was on 200 foot spacing and in several localities has a spacing of 100 ft. or less. Conoco carried resources on its books for this property; however it is difficult to isolate a precise value which can be allocated to the current LC East Project since their project boundaries did not coincide with URE’s currently defined project boundaries.
In 1978 Texasgulf joint ventured with Conoco as the operator on Project A. They continued defining the trend by drilling an additional 126 exploration holes through 1981, including three core holes of very shallow targets (less than 150 feet). Texasgulf discontinued their operations in the Great Divide Basin in 1983. Portions of the current LC East Project were later acquired by PNC Exploration in 1987. In 1990 they drilled 21 holes within the current LC East Project in conjunction with their activities on the MMT in the Lost Creek Project. Since then, no additional exploration drilling activity had been conducted in LC East until activities by URE in 2012. PNC released their property in 2000. Prior to acquisition by URE, a total of 1,064 historical exploration holes for a total of 474,582 ft. of drilling had been drilled within the currently defined LC East Project, including one water well which has since been abandoned. Drilled depths average 446 ft., ranging from 40 ft. to 2,257 ft. Exploration by URE has been limited to 16 stratigraphic test holes as discussed in Section 10.3.
LC North Project: Exploration Summary
The LC North Project is currently in the early to middle stage of exploration. The earliest exploration on record was several wide-spaced ‘wildcat’ drill holes in 1967 by Hecla Mining and Wolf Land and Exploration. This was followed in the late 1960s and early 1970s by more ‘wildcat’ drilling by Conoco, Inexco and Climax (Amax). Conoco also conducted some wide-spaced fence-line drilling in a few areas of interest, which included a few closer spaced holes drilled down to 150-200 foot spacing. In the late 1970s and early 1980s Texasgulf Minerals controlled the western portions of the current LC North Project and conducted some medium to wide-spaced drilling as part of their Lost Creek program. A minor amount of drilling was also conducted on the Project in this time frame by Minerals Exploration Company and Wold Nuclear. No drilling activity occurred after 1982. A total of 174 historical exploration holes had been drilled within the Project prior to acquisition by the Company (Table 4). Drilled depths ranged from 100 ft. to 1,200 ft., with an average of 600 ft. Several redox trends (defined in Section 8.0) were identified and mineralization was encountered in numerous holes, including seven mineralization intercepts which exceed URE’s current definition of “ore-quality”.
| 24 |
No exploration by URE in LC North has been conducted since the April 30, 2012 PEA.
LC South Project: Exploration Summary
The LC South Project is currently in the middle stage of exploration. Again, the earliest exploration on record was several wide-spaced ‘wildcat’ drill holes in 1967 as part of a regional joint venture operated by Wolf Land and Exploration. Conoco joined the joint venture in 1969 and carried on as the operator. It eventually took full control of the project, and between 1970 and 1975 drilled a few hundred holes within the current LC South Project. Minerals Exploration Company also drilled a few holes in 1969 within portions of land they controlled. In 1980 and 1981, Texasgulf extended its Conoco joint venture drilling activities into the current LC South Project area with approximately 150 drill holes. After 1981, no activity occurred within the Project area until acquisition by NFU Wyoming, LLC.
A total of 486 historical exploration holes were drilled within the current LC South Project prior to acquisition by the Company (Table 4). Historical drilling encountered numerous mineral trends which were investigated mainly by fence-line drilling. Spacing between fence-lines varied from 400 ft. to 1,000 ft. Within fence-lines, drilling was most commonly done on 200 ft. spacing. In the northern portions of the Project, considerable drilling was done on an approximate 200 ft. grid, including some drilling that was spaced as close as 100 ft. Drilled depths ranged from 200 ft. to 1,000 ft., with an average of 460 ft. Uranium mineralization was encountered, including 47 mineral intercepts which exceed URE’s current definition of “ore-quality”.
The southern portions of LC South which formerly comprised the Toby Project were extensively drilled by Minerals Exploration Company in 1982. Their efforts identified mineralization in a shallow trend called the K-Trend which they drilled on approximately 100 to 200 foot spacing. Approximately 101 holes were drilled to an average depth of 230 ft. Most of the mineralization occurs at depths of 150 ft. or less and therefore may be near or above the water table, rendering it unsuitable for in-situ recovery. Nonetheless, the trend holds significance in that its presence remains consistent with URE’s regional concept of alteration and mineralization. URE holds limited information on this drilling activity and possesses only two of the drill logs. Therefore the footage for this drilling has been excluded from Table 4, with the exception of those two holes, which have been combined with the LC South data.
No exploration by URE in LC South has been conducted since the April 30, 2012 PEA.
LC West Project: Exploration Summary
The LC West Project has only limited historical drilling and remains in the early stage of exploration. A total of 68 historical drill holes (approximately 44,564 ft.) are present within the Project. Wolf Land and Exploration drilled a few wide spaced holes in 1967, followed by several holes drilled by Conoco in the early 1970s. Texasgulf drilled approximately 33 exploration holes in portions of the Project between 1976 and 1981. Finally, Minerals Exploration Company drilled approximately 20 holes. The southern portions of the LC West Project are close to the northern extensions of the Rio Tinto (Kennecott) Sweetwater mineral trend (previously operated by Minerals Exploration Company).
No exploration by URE in LC West has been conducted since the April 30, 2012 PEA.
| 25 |
EN Project: Exploration Summary
The EN Project is currently in the early stage of exploration. Prior to acquisition by NFU Wyoming, LLC, exploration within what is now the EN Project consisted entirely of wide-spaced historical drilling. Between the late-1960s and mid-1970s, approximately 67 holes were drilled and logged by several companies, primarily Conoco, as part of their Project A, and Humble Oil (Exxon); with minor contributions by Kerr-McGee and Teton Exploration (Table 4). The earliest known exploration was conducted by Wolf Land and Exploration in 1967. Virtually no activity occurred after the late 1970s.
Holes averaged 800 ft. in depth, with some deeper holes greater than 2,000 ft. deep. Most of the historical drilling focused on the western and southern portions of the project area. The northernmost portions of the EN Project have no drilling. Drilling was generally done on an irregular grid, widely-spaced on roughly half-mile centers, with varying depths. A few areas were drilled in modified fence-line configurations, with holes averaging 200-500 ft. apart. Significant mineralization was encountered in scattered occurrences, but was rarely further investigated with closer-spaced drilling.
No exploration by URE in the EN Project has been conducted since the April 30, 2012 PEA.
| 6.3 | Previous Mineral Resource Estimates and Their Reliability |
Several historical estimations of mineral resources by previous operators have been made for uranium deposits within the current Lost Creek Property. Most focused on what is now referred to as the MMT and the EMT. However, because historical project boundaries varied considerably from the current project boundaries, direct comparison of historical estimates to current estimates is not possible.
Table 5 outlines various historical resource estimates covering areas within the Lost Creek Property that have been conducted by several organizations since 1978. It also lists NI 43-101 compliant resource estimates for the Lost Creek Project completed since 2006 through April 30, 2012. The historical resource estimates address diverse geographical areas, various host sand horizons, and utilize different or unknown resource determination methods. Consequently, these
historical estimates cannot be used as a direct comparison with the resource estimate presented in this report. Most of the earlier resource estimates did not differentiate resources in terms of currently recognized resource categories (Measured, Indicated, and Inferred). NI 43-101 compliant resource estimates in Table 5 are superseded by the resource estimates presented in this report.
| 6.4 | Production History |
Regionally, historical production activities have been from the production of numerous underground and surface mines in the Crooks Gap / Sheep Mountain District approximately 25 miles to the north; at the Sweetwater Mine and Mill approximately three and one-half miles to the south; and limited ISR production in the Bison Basin approximately 27 miles to the northwest (Figure 2). All of these mining activities had ceased by the mid-1980s.
Production at the Lost Creek Project commenced on August 2, 2013 with the initiation of production flow from MU1 and which continues to ramp up to full capacity anticipated in the second quarter of 2014. Elsewhere within the Property area, there has been no conventional or ISR production of uranium nor any pilot plant activities.
| 26 |
Table 5: Previous Resource Estimates
Total Resource (Geol. Inplace) |
Avg. Grade | LEVEL OF CONFIDENCE | ||||||||||||
| Date | Company | Cutoffs | TF | Comments | Measured | Avg. Grade |
Indicated | Avg. Grade |
Inferred | Avg. Grade | ||||
| 10/4/1978 | Texasgulf (Freeman, Limbach) 1 | 8,246,876 | 0.045% | 10'-0.025% | ----- | ----- | 6,468,515 | 0.047% | 1,778,361 | 0.039% | ||||
| 2/1/1981 | DOE 4 | 6,378,000 | 0.057% | 0.03% | p. 31, in-place resources | Not differentiated | ||||||||
| 2/1/1981 | DOE 4 | 8,908,571 | 0.041% | 0.02% | p. 31, in-place resources | Not differentiated | ||||||||
| 2/9/1981 | Wyoming Minerals 2,5,4 | 11,008,893 | 0.073% | 5'-0.05% | Not differentiated | |||||||||
| 6/5/1981 | Texasgulf 4 | 9,072,333 | 0.061% | 5'-0.03% | Polygon method | Not differentiated | ||||||||
| April,1982 | Texasgulf (Mouillac & Stewart) 3, 8 | 5,715,413 | 0.062% | 5'-0.03% | 16.0 | Polygon method | Not differentiated | |||||||
| 3/31/1989 | PNC Exploration-Halliwell 5 | 8,072,334 | 0.061% | 5'-0.05% | 16.0 | Polygon method | Not differentiated | |||||||
| Jan. 1996 | PNC Exploration (F.Groth) 6 | 7,908,605 | 0.05% | Not differentiated | ||||||||||
| 5/31/2005 | URE (Douglas) 7 | 9,021,371 | 0.055% | .03% , GT.30 | 16.0 | Cumulative GT/hole | ----- | ----- | 8,122,287 | 0.055% | 900,000 | 0.055% | ||
| 6/15/2006 | URE-NI 43-101 (Roscoe-Postle) 8,9 | See totals to right | 0.059% | 3'-.03%, GT.30 | 16.0 | Cumulative GT/hole (Ind + Inf) | ----- | ----- | 9,822,356 | 0.058% | 1,111,380 | 0.076% | ||
| 10/30/2006 | URE (Douglas) 10 | 6,787,000 | 0.059% | .03% , GT.30 | 16.0 | Cumulative GT/horizon | Not differentiated | |||||||
| 4/2/2008 | URE-Amended NI 43-101 (Lyntek) 11 | See totals to right | 0.054% | .03% , GT.30 | 16.6 | Cumulative GT/hole (Ind + Inf) | ----- | ----- | 9,200,000 | 0.053% | 700,000 | 0.066% | ||
| 3/16/2011 | URE -Prelim Assessment-(Trec) 12 | See totals to right | 0.055% | .02% , GT.30 | 16.6 | GT Contour/horizon [HJ, KM only] | 2,655,000 | 0.052% | 2,568,000 | 0.060% | 783,000 | 0.051% | ||
| 2/29/2012 | URE -Prelim Economic Assessment-(Cooper & Bull)13 | See totals to right | 0.055% | .02% , GT.30 | 16.6 | GT Contour/horizon [All Horizons] | 2,942,900 | 0.055% | 2,822,400 | 0.058% | 2,017,800 | 0.049% | ||
| 4/30/2012 | URE -Prelim Economic Assessment-(Cooper & Bull)14 | See totals to right | 0.053% | .02% , GT.30 | 16.6 | GT Contour/horizon [All Horizons] | 4,198,800 | 0.055% | 4,149,400 | 0.053% | 2,869,100 | 0.049% | ||
| 1. | Lost Creek- Conoco Reserves; P. Freeman, F. Limbach; October 4, 1978; Texasgulf internal report. |
| 2. | Appendix C, Resource Update as of 2/9/81; Unattached document, Texasgulf. |
| 3. | Geology and Control of the Uranium Mineralization on the “Main Mineral Trend” – Recommendations for the 1982 Program; J. Mouillac and M. Stewart, April 1982; Texasgulf internal report. |
| 4. | Lost Creek and Conoco Uranium Projects, Texasgulf Minerals and Metals, Inc.; January 1984, p. 31. |
| 5. | PNC Exploration (USA), Red Desert Project, D. Halliwell, March 31 1989, p. 17. |
| 6. | ISL Addressable Reserve Estimate for PNC’s Red Desert Uranium Project, F. Groth; January 29, 1996; Internal report for PNC. |
| 7. | Evaluation of Resources, Lost Creek Uranium Deposit; Richard Douglas, May 31, 2005; Ur-Energy USA, internal report. |
| 8. | Technical Report on the Great Divide Basin Uranium Properties, Wyoming Prepared for Ur-Energy Inc.; Stewart Wallis, P. Geo, Roscoe Postle, June 15, 2005, Revised October 15, 2005. |
| 9. | Technical Report on the Lost Creek Project, Wyoming, NI 43-101 Prepared for Ur-Energy Inc.; Stewart Wallis, P. Geo, Roscoe Postle, June 15, 2006. |
| 10. | Geological Report on the Lost Creek Uranium Deposit; Richard Douglas, October 30, 2006 Ur-Energy Inc., internal report. |
| 11. | Amended NI 43-101 Preliminary Assessment for the Lost Creek Project, April 2, 2008, as amended February 25, 2011; J. Kyle, PE, D. Maxwell, PE, Lyntek, Inc. and Stewart Wallis, P. Geo. |
| 12. | Preliminary Assessment Lost Creek Property Sweetwater County, Wyoming; D. Graves, PE, M. Yovich, PE, TREC, Inc., and R. Maxwell, CPG, Behre Dolbear & Company (USA), Inc.; March 16, 2011 |
| 13. | Preliminary Economic Assessment of the Lost Creek Property, Sweetwater County, Wyoming; J. K. Cooper, SME Registered Member & C. L. Bull, PE, Ur-Energy Inc., February 29, 2012 |
| 14. | Preliminary Economic Assessment of the Lost Creek Property, Sweetwater County, Wyoming; J. K. Cooper, SME Registered Member & C. L. Bull, PE, Ur-Energy Inc., April 30, 2012 |
| 27 |
| 7.0 | Geological Setting and Mineralization |
| 7.1 | Regional, Local, and Property Geology |
Regional and local surficial geology in the vicinity of the Lost Creek Property is shown on Figure 4. Figure 6 illustrates stratigraphic relationships of Tertiary sediments in the GDB, as well as that specific to the Lost Creek Property. Figure 7 provides a schematic illustration of a conceptual uranium roll front representative of that which occurs within the Property.
The Lost Creek Property is situated in the northeastern part of the GDB which is underlain by up to 25,000 ft. of Paleozoic to Quaternary sediments (Figures 4 and 5). The GDB together with the Washakie Basin to the south comprise the eastern half of the greater Green River Basin, which occupies much of southwestern Wyoming. The GDB lies within a unique divergence of the Continental Divide and is bounded by structural uplifts or fault displaced Precambrian rocks, resulting in internal drainage and an independent hydrogeologic system.
The surficial geology in the GDB is dominated by the Battle Spring Formation of Eocene age (Figure 4). The dominant lithology in the Battle Spring Formation is coarse arkosic sandstone, interbedded with intermittent mudstone, claystone and siltstone (Figure 8). Deposition occurred as alluvial-fluvial fan deposits within a south-southwest flowing paleodrainage. The sedimentary source is considered to be the Granite Mountains, approximately 30 miles to the north. Maximum thickness of the Battle Spring Formation sediments within the GDB is 6,000 ft.
Approximately six miles southwest of the Property, the Battle Spring Formation interfingers with the Wasatch and Green River Formations of equivalent age (Eocene) within a belt roughly 15 miles wide, as shown in Figures 4 and 6. The Wasatch and Green River together represent low-energy fluvial, lacustrine and paludal depositional environments which are time-equivalents of the alluvial fan deposits of the Battle Spring Formation.
Deep-seated regional thrust faulting associated with the Wind River thrusting occurred at depth in the central portions of the GDB. The horizontal component of displacement is possibly greater than nine miles. However, displacement does not extend to the surface. In addition, shallow normal faulting is also common throughout the GDB, having a preferential orientation that is generally east-west. These faults are relatively local and appear to be late stage events in the structural history of the Basin. Throws are generally less than 200 ft. and most commonly on the order of 25 to 50 ft. as illustrated by the Lost Creek Fault, discussed below. Strata within the GDB generally exhibit gentle dips of one to three degrees to the west and southwest, increasing to as much as 20 degrees in some locations along the basin margin. Gentle folding during late Eocene accompanied late-stage regional thrusting; therefore broad anticlinal and synclinal folds are present within the Battle Spring Formation. Similar to the shallow normal faulting, the fold axes generally are oriented east-west.
Uranium deposits in the GDB are found principally in the Battle Spring Formation, which hosts the Lost Creek Project deposit. Lithology within the Lost Creek deposit consists of approximately 60% to 80% poorly consolidated, medium to coarse arkosic sands up to 50 ft. thick, and 20% to 40% interbedded mudstone, siltstone, claystone and fine sandstone, each generally less than 25 ft. thick. This lithological assemblage remains consistent throughout the entire vertical section of interest in the Battle Spring Formation. Figure 8 illustrates a Type Log for the Lost Creek Project and is representative of the entire Property.
| 28 |
Outcrop within the Property is exclusively that of the Battle Spring Formation. Due to the soft nature of the formation, this occurs largely as sub-crop beneath the soil. The alluvial fan origin of the formation yields a complex stratigraphic regime which has been subdivided throughout the Property into several thick horizons dominated by sands, with intervening named mudstones (Figures 6, 8,10a, and 10b). Provided below is a brief description of each named stratigraphic unit or “Horizon” for the Lost Creek Property. Descriptions of lithology and thickness should be considered generalizations, and depths below ground surface (bgs) at which a given horizon can be encountered may vary considerably due to regional stratigraphic dip and displacement due to normal faulting.
DE Horizon -- The DE Horizon is locally absent in the northern and southern portions of the Lost Creek Property, having been removed by erosion. This Horizon consists of a sequence of sands and discontinuous clay/shale units. In portions of the Lost Creek Project, the lower shale boundary is absent such that the sands of the DE Horizon coalesce vertically with sands of the underlying FG Horizon. In the Lost Creek Project, the top of the unit ranges from 80 to 200 ft. bgs and is approximately 80 ft. thick where the entire section is present.
EF Shale -- Underlying the DE is the EF Shale interval. It can be characterized as mudstone or claystone, interbedded commonly with silt and sand. This unit is not always present due to the coalescing nature of the DE and FG sands.
FG Horizon -- In the Lost Creek Project, the top of the FG Horizon occurs at depths of approximately 150 to 300 ft. bgs. The total thickness of the FG Horizon is approximately 160 ft. The FG is generally composed of fine to coarse-grained arkosic sands with thin discontinuous intervals of fine sand, mudstone and siltstone. Stratigraphically, the FG Horizon is subdivided into the Upper FG (UFG), Middle FG (MFG) and the Lower FG (LFG). The FG contains significant mineralization in both the Lost Creek and LC East Projects.
Lost Creek Shale (LCS) -- Underlying the FG Sands is the Lost Creek Shale. The Lost Creek Shale is continuous across the Project, ranging from 5 to 45 ft. in thickness. Typically this unit has a thickness of 10 to 25 ft. Its lithology is dominated by silty mudstone and dense claystone. It commonly includes siltstone, and may locally be sandy or contain thin lenticular sands.
HJ Horizon -- The HJ Horizon is the primary target for uranium production at the Lost Creek Project and is the dominant host for mineral in the MMT and the EMT. The HJ Horizon has been subdivided into four sub-units: Upper HJ (UHJ), Middle HJ1 (MHJ1), Middle HJ2 (MHJ2) and the Lower HJ (LHJ). These sub-units are generally composed of coarse-grained arkosic sands, locally with thin discontinuous intervals of fine sand, siltstone and mudstone. Likewise, the four sub-units are separated by locally continuous mudstones and siltstones. The bulk of the uranium mineral is present in the two MHJ sub-units. The total thickness of the HJ Horizon ranges from 120 to 140 ft., averaging approximately 130 ft. The top of the HJ Horizon ranges from approximately 300 to 450 ft. bgs within the MMT at the Lost Creek Project. Depths shallow considerably to the north within the EMT in the LC East Project.
Sagebrush Shale (SBS) -- Beneath the HJ Horizon is the Sage Brush Shale. Within the Lost Creek Project the top of this shale ranges from 450 to 550 ft. bgs. The Sage Brush Shale is laterally extensive and ranges from 5 to 75 ft. in thickness. Lithology of the Sage Brush Shale is typically that of claystone and mudstone with interbedded silts and thin sands.
| 29 |
KM Horizon -- The KM Horizon is present beneath the Sage Brush Shale. The KM Horizon is generally coarse sandstone with discontinuous fine sandstone and mudstone intervals. The KM has also been further subdivided into the Upper KM (UKM) and the Lower KM (LKM). The KM Horizon is host to a significant portion of mineralization within the Lost Creek Project and therefore is a potential production aquifer. It also hosts resources in the LC East Project within the EMT. The top of the KM Horizon is usually between 450 and 600 ft. bgs within the Lost Creek Project, but only approximately 300 feet bgs in the northern portions of the LC East Project.
L, M, and N Horizons -- These horizons are collectively referred to by the Company as the “Deep Horizons” and occur within a 300 to 350 ft. interval below the KM Horizon. They consist of lithologies identical to that of the HJ and KM Horizons. Currently they are the targets of exploration activities. Individually each is approximately 100 ft. thick and is composed of multiple, stacked, coarse sands which are commonly separated by relatively thin, discontinuous shaley zones.
East-west oriented normal faulting is common within the central portions of the GDB. These appear to be the product of relatively late-stage structural adjustments. The last displacement of these faults is post-mineralization and has offset the mineral deposits. The MMT within the Lost Creek Project is bisected by a normal fault system, referred to as the Lost Creek Fault, consisting of two faults, roughly parallel, trending east-northeast to west-southwest (Figure 9). The easternmost main fault is down-thrown to the south with a maximum displacement of approximately 80 ft. A secondary fault is positioned along the western portion of the MMT and is located 800 to 1,600 south of the easternmost fault to which it is sub-parallel. This westernmost fault displays opposite displacement, downthrown to the north, with a maximum displacement of approximately 50 ft. Pump-testing and monitoring on both sides of both faults have demonstrated that the fault planes are effectively sealed within the HJ Horizon and thus represent hydrologic barriers or boundary conditions. The Fault is taken into consideration by wellfield planning and to date has not had a significant impact on production.
Fault have also been identified in the southern portions of LC East Project which exhibit displacement of from 40 ft. to 80 ft. (Figure 9) and may be systemically related to the Lost Creek Fault. The resulting opposing displacements on many of these faults produce horst and graben features that are local to portions of the Lost Creek Property. The presence of these faults will be a matter of consideration for production planning at LC East but, like the Lost Creek Fault, they are not considered to be significant obstacles. Additional significant faults have been identified within the Property, but are sufficiently distant as to have no effect on current or planned production.
| 7.2 | Hydrogeology |
The Property is located within the northeastern portion of the GDB. Due to a divergence in the Continental Divide, the basin is topographically closed, with all surface water draining to the interior of the basin. Available data suggest that groundwater flow within the basin is predominately toward the interior of the basin (Collentine, et al., 1981 and Welder, 1966).
Most of the surface water is runoff from precipitation or snowmelt. It quickly infiltrates the vadose zone and recharges the shallow groundwater, evaporates, or is consumed by plants through evapotranspiration. The shallowest aquifer within the Battle Spring Formation underlying the Property area is unconfined, poorly consolidated, and poorly stratified. The shallow water table is typically 80 to 150 ft. bgs.
| 30 |
Green Mountain, which is approximately 15 miles north of the Property, is a major recharge area for aquifers within the northeastern portion of the GDB (Fisk, 1967). The Rawlins Uplift, Rock Springs Uplift, and Wamsutter Arch, located east, southwest, and southeast, respectively, from the Property, are also identified as major recharge areas for aquifers within the GDB (Fisk, 1967). The main discharge area for the Battle Spring/Wasatch aquifer system is a series of lakes, springs and playa lake beds near the center of the basin. Groundwater potentiometric elevations within the Tertiary aquifer system in that portion of the basin are generally near the land surface.
The Battle Spring Formation crops out over most of the northeastern portion of the GDB, including all of the Property (Figure 4). It is considered part of the Tertiary aquifer system by Collentine, et al., (1981), which is viewed as the hydrogeologic sequence of interest within the GDB. This regional aquifer system includes the laterally equivalent Wasatch Formation (to the west and south) and the underlying Fort Union and Lance Formations (Figure 5). The base of the Tertiary aquifer system is marked by the top of the Lewis Shale. The Lewis Shale is generally considered a regional aquitard, although this unit does produce limited amounts of water from sandstone lenses at various locations within the GDB and to the south in the Washakie Basin. Units deeper than the Lewis Shale are generally too deep to economically develop for water supply or have elevated total dissolved solid concentrations that render them unusable for human consumption. Exceptions to this can be found along the very eastern edge of the basin, tens of miles from the Project, where some Lower Cretaceous and older units provide relatively good quality water from shallow depths.
Shallower aquifer systems that can be significant water supply aquifers within the GDB include the Quaternary and Upper Tertiary aquifer systems. The shallower aquifer systems are important sources of groundwater only in localized areas, typically along the margin of the basin where the Battle Spring Formation is absent. Aquifer systems beneath the Tertiary include the Mesaverde, Frontier, Cloverly, Sundance-Nugget and Paleozoic aquifer systems (Collentine, et al., 1981). In the northeast GDB, these aquifer systems are important sources of water only in the vicinity of their outcrops near structural highs such as the Rawlins Uplift.
Regional hydrologic units of interest within the northeast GDB from deepest to shallowest include the following (Figure 5):
| · | Lewis Shale (aquitard between Tertiary aquifer system and Cretaceous Mesaverde aquifer system); |
| · | Fox Hills Formation (Cretaceous); |
| · | Lance Formation (Tertiary aquifer system); |
| · | Fort Union Formation (Tertiary aquifer system); |
| · | Battle Spring Formation-Wasatch Formation (Tertiary aquifer system); |
| · | Undifferentiated Tertiary Formations (Upper Tertiary aquifer system, including Bridger; Uinta, Bishop Conglomerate, Browns Park, and South Pass). These units are not present within the Property. |
| · | Undifferentiated Quaternary Deposits (Quaternary aquifer system). |
| 31 |
Nomenclature for the hydro-stratigraphic units of interest within the Lost Creek Property is synonymous with the Property’s stratigraphic horizon names (Figure 6). The shallowest occurrence of groundwater within the Lost Creek Project area occurs near the base of the DE Horizon. The DE Horizon, however, is not saturated in all portions of the Lost Creek Project and is not defined as a groundwater unit. Below the DE is the FG Horizon, which is the first major saturated unit. The basal sand unit of the FG Horizon is designated as the overlying aquifer for the underlying HJ Horizon.
The primary uranium production aquifer is identified as the HJ Horizon. The HJ Horizon is bounded above and below by extensive confining units identified as the Lost Creek Shale and the Sage Brush Shale, respectively. The confining characteristics of these units have been demonstrated with pump tests performed by URE and are considered regional aquitards; therefore the HJ Horizon as a whole is hydrologically a confined aquifer. The four sub-units within the HJ Horizon are commonly separated by thin clayey units that are not laterally extensive and, based on pump test results, are not confining with respect to each other and do not prevent vertical movement of groundwater within the HJ Horizon.
Potentiometric surface data in the HJ Horizon indicate that the near vertical Lost Creek Fault provides a significant hydraulic barrier to horizontal groundwater flow. The potentiometric surface on the north side of the fault is 15 ft. higher than on the south side. The fault’s hydraulic barrier effect was confirmed during a long-term pump test in 2007 and again in subsequent tests in 2009, 2010 and 2011. Potentiometric data indicate that within the Lost Creek Project groundwater flows to the west-southwest, generally consistent with the regional flow system.
Beneath the HJ Horizon and the Sage Brush Shale is the KM Horizon. The KM Horizon represents the underlying aquifer to production in the HJ Horizon. It also hosts mineralization and therefore is a potential secondary production aquifer. Inversely, the lowermost sand of the HJ Horizon, the LHJ, is designated as the overlying aquifer for the potential production in the KM Horizon. Both the underlying confining unit to the KM Horizon and the corresponding underlying aquifer have yet to be determined and are the subject of an ongoing investigation.
The deeper sand horizons, the L, M and N, are separated by shaley aquitards, however there is insufficient data at this time to substantiate that these aquitards are regionally continuous.
URE has been collecting lithologic, water level, and pump test data as part of its ongoing evaluation of hydrologic conditions at the Lost Creek Project. In addition to URE’s data collection, historical hydrogeological data collected for Texasgulf (Hydro-Search, Inc., 1982) were used to support this hydrologic evaluation. Water level measurements, both historical and recent, provide data to assess potentiometric surfaces, hydraulic gradients and inferred groundwater flow directions for the aquifers of interest at the Project. Long-term pump test (Petrotek Engineering Corporation, 2007) and several shorter-term pump tests (Hydro-Engineering, 2007, 2009, 2010, 2011, 2012), as well as the pump tests conducted for Texasgulf (Hydro-Search, Inc., 1982), were used to evaluate hydrologic properties of the aquifers of interest, to assess hydraulic characteristics of the confining units, and to evaluate impacts to the hydrologic system of the fault through the Lost Creek Project.
In October 2011, hydrologic investigations were conducted to provide support for a proposed amendment application to include the KM Horizon within Resource Area 3 (RA3) in current state and federal permits. A regional pump test was completed in the KM Horizon in RA3 at a pumping well located south of the Lost Creek Fault. The testing objectives were to: 1) evaluate the hydrologic aquifer characteristics, 2) demonstrate hydrologic communication between the KM Horizon pumping well and the surrounding monitor wells, 3) evaluate the presence of hydrologic boundaries, and 4) demonstrate isolation between the KM Horizon and the overlying and underlying horizons sufficient for the purposes of ISR mining. The test results indicated: 1) varying degrees of hydraulic communication between the two underlying L and M Horizons, thus indicating that the KM Horizon is hydraulically connected, 2) drawdown responses in the overlying HJ Horizon and the lowermost N Horizon were minor, and 3) the Lost Creek Fault acts as a partial barrier to flow as a zone of lower permeability.
| 32 |
In October 2012, “5-spot” hydrologic testing was completed in the KM Horizon in Resource Area 3, which supplemented the regional pump test conducted in October 2011. The purpose of the testing was to assess the level of hydraulic communication between the KM Horizon (potential production zone) and the underlying L, M and N Horizons and also the overlying HJ Horizon within a pattern of wells simulating a typical commercial scale 5-spot production pattern. Extraction testing conducted in the KM Horizon indicated varying degrees of hydraulic communication between the two underlying L and M Horizons confirming that these horizons are hydraulically connected. Based on hydrologic testing results to date, it is anticipated that the minor communication between the KM Horizon and the overlying and underlying horizons can be managed through operational practices, detailed monitoring, and engineering operations.
In August 2013, a mini pump test was conducted in Mine Unit 2 for the purpose of assessing the level of hydraulic communication between the HJ Horizon and the overlying and underlying Horizons, with the focus on the role that historical exploration drill holes might play in cross-aquifer communication. Based on the minimal or lack of response observed in the overlying and underlying Horizon observation wells, the abandoned historical exploration drill holes appear sealed and are not providing a flow conduit between the Horizons in the tested area.
To date, the LC East Project area has not been hydrogeologically tested. However, URE has installed 26 monitoring wells into the various FG, HJ, KM and N Horizons. Water level and chemistry data are being collected from all Horizons. The similarity in geologic setting to those observed in the Lost Creek Project area implies that the hydrogeology conditions should also be similar. The water level data indicate fully saturated and confined aquifers throughout most of the mineral trend. Hydrogeologic testing is planned the fourth quarter 2013.
The Technical Report portion of the Lost Creek ISR, LLC application for NRC Source and Byproduct Materials License, Section 2.7, concludes that the uranium-bearing sandstone horizons within the upper Battle Spring Formation appear to be suitable targets for ISR operations. The primary production zone aquifer (HJ Horizon) is bounded by laterally extensive upper and lower confining units, as demonstrated by static water level differences and responses to pump tests. Aquifer properties (transmissivity, hydraulic conductivity and storativity) are within the ranges observed at other ISR operations that have successfully extracted uranium. Water quality is generally consistent throughout the hydro-stratigraphic units of interest. Elevated radionuclides are present in the groundwater, but this is consistent with the presence of uranium mineralization within the sandstones. The Lost Creek Fault acts as a hydraulic barrier to flow and has been considered in mine unit design and operation (Ur-Energy Inc., 2007a, b). Production results to date confirm that the Project is suitable for ISR mining.
| 7.3 | Mineralization of the Lost Creek Property |
Mineralization at the Lost Creek and Adjoining Projects occurs as roll front type uranium deposits. Roll front type deposits are further described in Section 8.0.
| 33 |
Mineralization occurs in sand horizons within the Eocene-age Battle Spring Formation (Figures 5, 6 and 8). The most significant mineral resources in the Lost Creek Property occur within two major stratigraphic horizons, the HJ and the KM Horizons. The HJ Horizon carries the large majority of the currently defined mineral resources and hosts the current production activities. As discussed earlier, the HJ Horizon is subdivided into four stratigraphic sub-horizons which are also applied to resource reporting. The richest concentration of uranium mineralization occurs in the MHJ sub-horizon. Each sub-horizon, in turn, may consist of multiple mineralized roll fronts. The HJ Horizon, as a whole, contains up to 11 individual roll fronts within a stratigraphic interval of approximately 130 ft.
The KM Horizon underlies the HJ Horizon and contains additional significant mineralization which will be targeted for future production later in the Lost Creek Project mine plan. Mine approvals for the KM Horizon will be addressed by a proposed amendment to the mine license and permits. To date, a total of nine individual roll fronts have been identified in the KM Horizon within a stratigraphic interval of approximately 100 ft. Roll fronts in both the HJ and KM Horizons extend beyond the limits of the Main Mineral Trend (MMT) as discussed below in Section 9.2.
Mineral resources currently targeted for mining in the Lost Creek Property occur within two major trends. In the Lost Creek Project resources are focused in an east-west oriented trend approximately three miles long and 500 to 2,000 ft. wide, which is referred to as the Main Mineral Trend (MMT) (Figure 9). The primary mineral interval at the Lost Creek Project occurs within the HJ Horizon (Figures 6 and 8). Mineralization targeted for mining has also been identified within the underlying KM Horizon. The FG Horizon also contains considerable mineralization.
A second mineral trend of significance, the East Mineral Trend (EMT), was identified by historical drilling within the LC East Project. Although geologically similar, it appears to be a separate and independent trend from the MMT. The EMT assumes a generalized northeast-southwest orientation extending for approximately six and one-half miles with a width of 500 to 1,500 ft. (Figure 9). As in the MMT, the known mineralization occurs mainly in the HJ and KM Horizons. Significant occurrences have also been identified in the FG Horizon.
Based on their evaluations, URE geologists suggest that at least two regional alteration systems can be identified on the Lost Creek Property. The MMT is a local, but not unique, occurrence of mineralization within one of those regional systems. Mineralization observed within the EMT in LC East Project and that in the other Adjoining Projects exhibits similar roll front characteristics as observed in the MMT but is believed to be the product of a different regional geochemical system.
Geological evaluations of historical drill data and URE drill data have resulted in the recognition of numerous additional geochemical fronts and mineral occurrences within the Lost Creek Property. Historical exploration drilling by previous operators has been conducted within all the projects. In addition, URE has conducted exploration drilling in the LC North, LC South, and EN Projects plus limited exploration drilling in LC East. These activities are discussed in Sections 6.0 (History), 9.0 (Exploration) and 10.0 (Drilling).
Mineralization has also been recognized throughout the Lost Creek Property in horizons deeper than the KM, in what are referred to as the Deep Horizons (L, M and N). Recent and historical drill hole data confirm multiple roll fronts with locally identified Inferred resources in these horizons. These occurrences are discussed in Section 9.0 (Exploration). URE anticipates future exploration drilling to further define the resource potential of these stratigraphic horizons.
| 34 |
Lost Creek Project
The combined HJ and KM mineral trend in the Lost Creek Project, generally referred to as the MMT, extends in an east-northeast to west-southwest orientation for nearly three miles. Individual roll fronts within the deposit are typically 25 to 75 ft. wide and are very sinuous. They are stacked vertically and commonly overlie each other in a complex, erratic, anastomosing pattern in plan-view, as illustrated in Figure 9. Thickness of mineralization within each roll front may vary from 5 to 25 ft. thick. Typical thickness is from 10 to 15 ft. Strata within the deposit are nearly horizontal; therefore data derived from vertical down-hole gamma logs can be considered reasonable measures of true thickness. Mineral intercepts of over 25 ft. in total thickness are common where multiple roll fronts occur stacked on top of each other. Average grade within the Lost Creek MMT is approximately 0.057% eU3O8.
Mineralization has also been identified along the MMT within horizons both above and below the HJ and KM. Shallower units, the FG Horizon, and to a lesser extent the DE Horizon, both contain numerous occurrences of mineralization. These horizons have not been specifically targeted by recent drilling. Rather, current knowledge of these occurrences was derived from drilling which targeted deeper horizons. URE has conducted a thorough review of the mineralization within the FG and the results are contained within the current resource estimate. Currently recognized mineral within the DE, however, is deemed insignificant and therefore not included in the resource estimate reported herein. Furthermore, most of the DE Horizon lies above the water table and thus is not amenable to in situ recovery.
Depth to the top of any given unit can vary from one end of the MMT to the other by up to 220 ft. due to the regional dip of one to three degrees, and to displacement by normal faulting. Within the Lost Creek Project the depth to mineralization in the HJ Horizon ranges from approximately 320 to 600 ft., averaging 435 ft. In the KM Horizon, mineralization ranges from 425 to 685 ft., averaging 515 ft.
Mineralogy of the zone of interest has been studied in thin section and by x-ray diffraction analysis. Mineralogical analyses were conducted in 1979 by Russell Honea (Honea 1979a and b), and in 2007 by Hazen Research (Hazen, 2007) on samples derived from core. Results indicate that the uranium occurs primarily as the mineral coffinite (uranium silicate) in the form of micron- to submicron-size inclusions disseminated in and on interstitial clay, possibly absorbed by cation exchange; also intimately interspersed through some of the pyrite and as partial coatings on quartz and biotite. Minor amounts of uraninite (uranium oxide) and brannerite (uranium-titanium oxide) have also been identified. Clay rich fractions are predominantly smectite (montmorillonite), with minor kaolinite.
The Hazen Research analysis concluded that uranium should be recoverable by an ISR operation because of the unconsolidated nature of the sandstone and expected diffusion of the lixiviant through the smectite minerals. Recoverability has been confirmed by leach testing (Section 13.0) and by early production results.
Adjoining Projects
The nature of mineralization in the Adjoining Projects is virtually identical to that in the Lost Creek Project, that being roll front uranium deposits.
The status of Adjoining Projects in the Lost Creek Property ranges from early to late exploration stages to early delineation stage. URE geologists have reviewed data from historical and recent exploration drill holes throughout the Property. Their evaluations indicate that roll front trends which are present in the Lost Creek Project extend northerly and southerly into the Adjoining Projects. This has been confirmed by the Company’s drilling programs.
| 35 |
Similar to the Lost Creek Project, the mineralization on the Adjoining Projects occurs as multiple roll fronts, each typically 25 to 50 ft. wide. These roll front trends are found within stratigraphic intervals from near surface to over 1,000 ft. in depth, including the same HJ and KM Horizons which host the MMT. Where significant mineralization has been identified along these fronts, Inferred mineral resources have been estimated and are discussed in Section 14.5 of this document.
Exploration in the LC East Project ranges from middle to late exploration stages in the northern portions to early delineation stage in the southern portions. The EMT represents approximately six and one-half miles of stacked roll fronts oriented generally southwest to northeast (Figure 9). As on the Lost Creek Project, the HJ and KM Horizons contain the vast majority of the mineral. Mineralized horizons within the HJ Horizon range in depth from approximately 100 ft. to 400 ft. bgs, and within the KM ranges from approximately 200 ft. to 500 ft. bgs. Due to regional dip and normal faulting the depths to like mineralized horizons can vary by approximately 300 ft. from the northern to southern ends of the LC East Project. Mineralization has also been identified within the shallower FG Horizon and to a lesser degree within the Deep Horizons L and M. The quality of mineral is consistent with that in the same horizons within the Lost Creek Project. The average grade for the Measured plus Indicated resources within the EMT is approximately 0.048%.
Regional roll front trends which have been recognized within the Adjoining Projects represent, in composite, a total of approximately 35 linear miles of trend. Most of these remain untested. Employing the MMT as a model, URE geologists believe there may be additional mineral resources within the Adjoining Projects. Results from recent drilling campaigns (Section 9.2) are consistent with this assumption.
| 7.4 | Disequilibrium |
Uranium values derived from gamma data are termed “radiometric” values and are assumed to be equivalent (eU3O8) to true uranium values if equilibrium is present. In other words, equilibrium exists when the ratio of radiometric eU3O8 to true chemical U3O8 is 11. This can be determined by obtaining physical samples of the mineralized formation and conducting laboratory analyses of their uranium content; or by modern logging methods, including Prompt Fission Neutron logging (PFN). The true uranium content thus derived is then compared to the radiometric values in terms of GT on a per-mineralized intercept basis and that ratio is considered the Disequilibrium Factor for that mineral intercept.
The uranium content used by URE to develop the mineral resource estimates in Section 14.0 has been derived mainly from radiometric geophysical logs (gamma logs) from which the uranium content is interpreted assuming radiometric equilibrium. Justification for this interpretation method is described below.
Disequilibrium in roll front deposits becomes an issue largely because of the possibility of remobilization of uranium during the roll front formation process, or possible dispersion by modern shallow oxidizing groundwater. Each circumstance may lead to separation of uranium from its gamma-emitting daughter products, most significantly bismuth isotope 214 (214Bi), which is the isotope most strongly detected by gamma logging. Since the presence of uranium is traditionally detected using gamma measurements, disequilibrium conditions could result in erroneous estimation of uranium values.
Disequilibrium within the MMT in the Lost Creek Project has been studied extensively. Core of selected mineralized zones from historical drilling and drilling conducted by URE from 2005 through 2010 have been analyzed for chemical uranium on one-foot depth intervals. Detailed comparisons of laboratory results against mineralization values derived from gamma logs have been performed.
| 36 |
In addition, PFN technology has been available for use at the Lost Creek Project drilling campaigns since 2008. The PFN tool provides a direct down-hole analysis of uranium by means of in-place fission of 235U initiated by the emission of high energy neutrons. Output of the PFN logging is in much the same format as that from the gamma logging tool. Comparison of the mineralization reported by each method has been evaluated in detail on a per-mineral intercept basis. For any given intercept, GT values are derived from both the gamma and PFN data. A Disequilibrium Factor (DEF) is then reported as the ratio of GT values: PFN GT ÷ Gamma GT. Thus, a value greater than 1.0 indicates chemical enrichment compared to gamma, and a value less than 1.0 represents chemical depletion.
Mineral intercepts within virtually all stratigraphic horizons and roll front zones have been spot-tested by PFN-logging. PFN sampling methods are discussed in Section 11.0. In the Lost Creek Property, a total of 607 mineral intercepts within 277 drill holes have been logged using PFN technology. This represents approximately 9% of all holes drilled by URE within the Property.
Detailed evaluation of the core and PFN results indicates that the MMT in the Lost Creek Project as a whole is in equilibrium. In general, DEF variability can be observed, but when charted, is quite scattered and appears random. No discernible pattern of DEF in any given area could be detected as an indicator of remobilization. A statistical analysis of the data revealed that the deposit exhibits disequilibrium characteristics consistent with a relatively stable roll front deposit, including slight chemical enrichment common in the reduced facies of the Nose and Seepage zones where the vast majority of resource resides. Conversely, a slight depletion is recognized in oxidized facies behind the front. A statistical average of all significant mineral intercepts analyzed with PFN in the MMT yielded an average DEF of 1.14, or moderately enriched. In spite of this fact, resource estimation methods employed by URE assume equilibrium (or DEF of 1.0) in or order to maintain a conservative perspective.
Within the land currently covered by the LC East Project, Conoco drilled 13 historical core holes in 1969 and 1970 which sampled the HJ and KM Horizons. One core hole involved side-wall coring, which URE considers to be of limited value. Data from the remaining 12 core holes have been evaluated for disequilibrium characteristics by URE geologists. Approximately half of those are hindered by incomplete core recovery and questionable data; however some general observations can be made. Mineralization occurring within reduced sand facies is normally in equilibrium and sometimes strongly enriched chemically. However it appears that portions of the mineral trend have experienced a surge of late stage, post-roll front oxidation from an unknown source resulting in localized zones of alteration which are not reflected in the gamma signature of mineral intercepts. Core analyses show that uranium content within these altered zones is significantly depleted while, conversely, uranium is commonly significantly enriched in adjacent reduced facies. This suggests remobilization of uranium and subsequent re-deposition within the roll front system in portions of the LC East Project.
To investigate the potential impact of this situation URE drilled three PFN profiles in the fall of 2012 near historical core holes and delineation holes which had exhibited indications of remobilization. A total of 18 holes were drilled. Each profile consisted of a line of five to eight close-spaced drill holes which laterally crossed the suspected zone of remobilization. Each hole was PFN logged in target zones within the HJ or KM Horizons.
| 37 |
The results confirmed that late stage alteration and remobilization has occurred locally. In most cases this is limited to only a portion of the mineral horizon. Remobilization and subsequent re-deposition and enrichment generally occurs within a short horizontal distance, usually 25 to 50 feet but locally as much as 75 feet. The pattern of enrichment implies that there is no loss of mineral content due to this condition, but rather a shift in location. In general the tests reveal that remobilization is a condition which will need to be monitored at the LC East Project. Fortunately it can be easily detected in drill cuttings by the presence of altered sand (colored red or yellow) in roll front environments which are normally hosted by reduced (gray) sand. If detected or suspected it is believed that gamma log results remain as a reasonable estimate of mineral content; however PFN logging will be crucial for revealing the true location of mineralization.
In summary, all resource estimations in the Lost Creek Property herein have been based on radiometric data derived from gamma-logs employing a DEF value of 1.0 (equilibrium). As discussed above, the core and PFN results in the Lost Creek Project confirm that the resources in the MMT (Section 14.0) do not need to be adjusted for chemical disequilibrium. Mineralization within the EMT in the LC East Project locally displays indications of remobilization; however it is accepted that resources based on gamma data remain valid, pending confirmation by PFN logging (see also Section 11.0).
| 8.0 | Deposit Type |
Uranium mineralization identified throughout the Property occurs as roll front type deposits, typical in most respects of those observed in other Tertiary Basins in Wyoming. Figure 7 schematically illustrates the geometry and mineralogical model of a typical roll front uranium deposit. The formation of roll front deposits is largely a groundwater process that occurs under favorable geochemical conditions. The most favorable host rocks for roll fronts are permeable sandstones within large aquifer systems. Interbedded mudstone, claystone and siltstone are often present and aid in the formation process by focusing groundwater flux.
The geometry of mineralization is dominated by the classic roll front “C” shape or crescent configuration at the alteration interface (Figure 7). The highest grade portion of the front occurs in a zone termed the “Nose” within reduced ground just ahead of the alteration front. Ahead of the Nose, at the leading edge of the solution front, mineral quality gradually diminishes to barren within the ‘Seepage’ zone. Trailing behind the Nose, in oxidized (altered) ground, are weak remnants of mineralization referred to as “Tails” which have resisted re-mobilization to the Nose due to association with shale or other lithology of lower permeability. Tails are generally not amenable to in situ recovery because the uranium is typically found within strongly reduced or impermeable strata, therefore making it difficult to leach.
The source of the uranium within the Lost Creek Property is speculative. Boberg (2010) suggests that the source within this portion of the Wyoming Uranium Province is a combination of: (1) leaching of uraniferous Oligocene volcaniclastics which once covered the basins and (2) weathering and leaching of uraniferous Archean granite of the Granite Mountains (north of the GDB) which also represent the provenance of the arkosic sands comprising the Battle Spring Formation.
Oxygenated surface water passing through the overlying thick sequences of volcaniclastic material leached metals, including uranium. These metal-enriched fluids may have also leached additional uranium from the granitic content of the arkosic sands which compose the aquifers. The enriched, oxidizing fluids subsequently entered the regional groundwater systems within the basin and migrated down-dip through the aquifers as large oxidizing geochemical cells referred to as solution fronts.
| 38 |
Uranium precipitated in the form of roll front deposits at the leading edge of the geochemical cells where they encountered reducing geochemical environments within the host sands. Mineral quality was enhanced where groundwater flux was focused horizontally by paleochannels or vertically by aquitards. Continuity of these conditions produced a significant accumulation of uranium at the reduction-oxidation (redox front) interface. In addition, the continued supply of oxygen to the interface leads to degradation of the reducing environment and results in migration down-dip of the redox interface, thus remobilizing the associated uranium with it. In this manner the uranium deposit slowly migrated down-dip over geologic time.
The reducing environment in the host sand is generally the result of carbonaceous material within the formation or leaked reductant gases originating from deep hydrocarbon sources. Pyrite is inherently associated with both and is a significant indicator of a reducing environment. Reduced sands are typically some shade of gray and represent the regional framework prior to mineralization. The reducing environment is subsequently altered by the passage of the oxidizing solution front. Alteration typically involves oxidation of pyrite and other iron bearing minerals to hematite or limonite/goethite and destruction of carbonaceous material. As a result, altered (oxidized) sands are typically reddish or yellowish in color.
Mineralization within a roll front varies considerably in size and shape, but is generally long, narrow and sinuous in map view. The total length of a mineral trend may extend for several miles. Commonly, a deposit or mineral trend will consist of a composite of multiple, vertically-stacked roll fronts. Typical width of an individual roll front is generally 25 to 100 ft. However, in the case of multiple stacked fronts, the composite width may be several hundred feet across. Typical thickness of an individual roll front is roughly 5 to 25 ft. and the composite thickness of multiple, vertically stacked fronts may occupy as much as 200 ft.
As described above, the MMT, the EMT and extension trends throughout the Property are the product of large regional geochemical alteration systems which resulted in a complex composite of multiple, stacked roll fronts at the reduction-oxidation interface. The roll front model and associated mineral trends are the basis upon which the exploration and development programs are planned.
| 9.0 | Exploration |
Virtually all exploration for uranium roll front deposits is done by drilling. No other exploration methods have been employed with any success within the Property. This is consistent with conventional practices for roll front uranium exploration in Wyoming basins. Consequently, this section of the report focuses solely on drilling by URE for the purpose of exploration. Section 10.0 “Drilling by URE” deals with drilling for other purposes. Previous (historical) exploration efforts conducted in the Property area by numerous companies are described in Sections 6.1 and 6.2. No exploration drilling has been conducted by URE since the April 30, 2012 PEA, with the exception of stratigraphic test holes in LC East.
| 9.1 | URE Exploration – Lost Creek Project |
Since acquiring the Project, drilling activities by URE have focused primarily on delineation of the MMT in planned production wellfield areas, and installation of monitor wells, pump-test wells, and production pattern wells. Therefore, exploration activity within the Lost Creek Project has been relatively limited.
| 39 |
In 2007, six wide-spaced holes drilled at the request of the WDEQ for the purpose of identifying stratigraphic control identified new redox trends in previously undrilled areas within Section 25, T25N, R93W in the southern portions of the Project. Subsequently, in years 2008 through 2011 (excluding 2009), approximately 159 exploration holes were drilled in the Lost Creek Project to test potential extensions of roll fronts from the MMT. This included 50 exploration holes in the 2011 drilling campaign within Section 16 (state section). The goal was to test potential easterly extensions of the MMT and to assess potential in the Deep Horizons. Results from this exploration drilling were detailed in the Preliminary Economic Assessment of the Lost Creek Property, dated February 29, 2012. No exploration activity has taken place on the Lost Creek Project since that report.
| 9.2 | URE Exploration - Adjoining Projects |
The locations of the Adjoining Projects are shown on Figure 2. Mineralization on these Projects is discussed in Section 7.4. Historical exploration activities are discussed in Section 6.2. No exploration activity has taken place on any of the Adjoining Projects since the April 30, 2012 Preliminary Economic Assessment, with the exception of stratigraphic test holes in LC East. Exploration activities by URE prior to that report are reviewed below. Additional drilling is needed throughout the Adjoining Projects in order to correlate mineral horizons and to evaluate their potential. URE is developing plans to continue the exploration and evaluation of redox fronts identified by drilling to date.
LC East
No exploration drilling has been conducted on the LC East Project since acquisition with the exception of 16 holes drilled during the 2012 drilling campaign for the purpose of stratigraphic control. Activities at LC East have focused on pre-development activities as discussed in Section 10.3).
LC North
The LC North Project is located to the north and to the west of the Lost Creek Project. Historical wide-spaced exploration drilling on this property consisted of 174 drill holes (Section 6.2 and Table 4). In years 2007 and 2011, URE conducted exploration drilling programs to better define roll front trends within the Project. A total of 135 plug holes and 1 water well (137,322 ft.) were drilled. The targets were areas of mineralization identified by historical drilling by Texasgulf. A portion of the holes were drilled as nearby offsets of historical mineralized holes and within drill “fence-lines” across fronts to further characterize the mineralization. The remainder were more widely-spaced to gain knowledge of the regional geologic framework. The drilling results identified the presence of mineralization occurring in multiple horizons, many of which correlate stratigraphically with mineralized horizons in the MMT. These drilling programs resulted in the definition and addition of 398,200 lbs. of Inferred resource, adding to the Property resource base and reported in the February 29, 2012 PEA. No drilling has been conducted since that PEA.
In general, results from URE’s 2007 and 2011 LC North drilling campaigns revealed significant mineralization including 30 mineral intercepts considered strong mineral (GT ≥ 0.15, grade ≥ 0.020% eU3O8) plus 21 mineral intercepts which exceed URE’s current definition of “ore-quality.” In addition to the HJ and KM Horizons, significant mineralization was also identified in the L, M, and N Horizons in the north area of the drilling. These occurrences were considered new discoveries in areas and horizons not previously recognized.
| 40 |
LC South
The LC South Project is located to the south and southeast of the Lost Creek Project (Figures 1 and 2). Historical drilling on the LC South Project consisted of 486 drill holes (Section 6.2 and Table 4). In 2010, URE drilled a total of 159 exploration holes (101,111 ft.) mostly in the northern portions of the Project throughout Sections 28 to 30, T25N, R92W which confirmed numerous individual roll front systems occurring within several stratigraphic horizons correlative to mineralized horizons in the Lost Creek Project (Figure 9). The 2010 drilling program also included a series of wide-spaced framework drill holes up to 1,200 ft. in depth throughout Sections 27 and 30, T25N, R92W to investigate regional stratigraphy and alteration patterns. These holes identified deep oxidation (alteration) that represents the potential for several additional roll fronts in the Deep Horizons. Further follow-up drilling is required on the LC South Project to evaluate these deep redox fronts. Exploration drilling activity by URE added 602,600 lbs. of resources in the Inferred category which are included, as of the February 29, 2012 PEA, in the total resources for LC South reported in Table 10 and illustrated in Figure 9. There has been no exploration drilling at LC South since that PEA.
LC West
No exploration drilling has been conducted on the LC West Project since acquisition.
EN Project
The EN Project is contiguous with and east of LC South. Approximately 67 historical exploration holes were drilled within the current EN boundaries prior to acquisition by URE (Table 4). In 2007, URE drilled three deep exploration holes in the northwest portions of the Project totaling 8,590 ft. to test mineralization below 2,000 ft. which had been detected in an abandoned oil and gas test well. Mineralization in that test well included an intercept of 6.5 ft. of 0.10% eU3O8 at 2,200 ft. depth (measured through steel casing), indicating that the presence of mineralized roll fronts may persist at depth. Results of the three exploration holes substantiated mineralization at depth, but were unable to reproduce the uranium content. However, the presence of alteration at depth was confirmed.
In 2008, 11 wide-spaced exploration drill holes, and one water well, were completed in the southeast portions of the Project. Maximum drilled depth was 1,170 ft. and total drilled footage was 11,389 ft. Nine drill holes showed evidence of alteration and multiple mineralized horizons at depths between 500 and 950 ft. No drilling has been conducted in the EN Project since 2008.
| 10.0 | Drilling by URE |
Drilling within the Lost Creek Property prior to acquisition by URE is discussed in Sections 6.1 and 6.2. Since acquiring the Property, URE has drilled a combined total of 1,739 plug holes, 321 monitor wells, 12 water wells and 914 production pattern wells within the Projects (through August 31, 2013). These numbers include exploration drilling as discussed above in Section 9.0, and include wells which were installed but abandoned for various reasons prior to use. A statistical summary of URE’s drilling programs plus historical holes, to date, is included as Table 4.
10.1 Explanation of Drill Hole Categories
Drill holes are categorized either as “Plug Holes” or “Wells”:
| § | Plug holes are drilled for information only. They are plugged and abandoned as soon as possible after the drilling and logging of the hole. |
| § | Wells are holes which have been cased for various long-term purposes. |
| 41 |
The purpose of drilling may fall into the following categories:
Plug Holes
There are two primary purposes for plug hole drilling:
| · | Exploration drilling implies that the plug holes are drilled outside of a recognized mineral deposit, with the goal of identifying new resources. |
| · | Delineation drilling is plug hole drilling on relatively close spacing (typically 100 foot) for the purpose of defining, in detail, the quality and extent of potentially minable mineral previously discovered by exploration drilling. The assumption is that wellfield planning can start after completion of the delineation phase of drilling. Note that delineation drilling generally does not increase resource inventories, but rather will increase the level of confidence of previously-identified mineral resources. |
Other types of plug drilling may include:
| · | Confirmation drilling for the purpose of verifying historical drill data. |
| · | Condemnation drilling which is done to substantiate that proposed facilities do not overlie significant and possibly minable mineral. |
| · | Coring is a ‘secondary’ categorization that involves the collection of undisturbed rock samples. Coring may be the main purpose of the hole, or it may be a secondary objective done during the ‘pilot’ hole phase of any hole drilled for any other intention. (Note that in Table 4, cored holes are counted within other drill hole categories.) Coring is normally done only in selected intervals within a hole. Rarely is a drill hole cored top to bottom. |
| · | PNC Holes (Pilot Not Cased) are pilot holes drilled as the first stage for installation of pattern wells which for various reasons were not cased and were subsequently plugged and abandoned. |
Wells
There several purposes for installing wells:
| · | Baseline Monitor Wells are drilled to gather water samples and measure water levels for the purpose of characterizing aquifers before production. |
| · | Pump Test Wells are also for aquifer characterization by means of conducting a pump test. Typically, a pump test will employ one pump well and several observation wells. Observation wells may be completed in the pumped aquifer or aquifers above or below the pumping well. Note that wells installed for any other purpose may also be employed as observation wells. |
| · | Production Monitor Wells may include: |
| o | Perimeter Monitor Wells which are completed within the production aquifer. They are arranged in a ring surrounding the production area which is offset at a prescribed distance. Their purpose is to detect undesired migration of production fluids. |
| o | Interior Monitor Wells monitor groundwater in an overlying or underlying aquifer, or possibly also within the production aquifer. They are located within an area planned for production, interior to the Perimeter Monitor ring. Typically these are sampled multiple times prior to operation of a wellfield to determine baseline characteristics of the overlying, underlying and production aquifers. |
| 42 |
| · | Pattern Wells (Production Wells) are for the direct purpose of producing uranium: |
| o | Injectors are used to inject the production lixiviant (chemically enhanced water) into the production formation. |
| o | Producers pump the resultant uranium bearing water out of the formation. |
| · | Water Supply Wells are wells completed to supply water for drilling or for any other purpose. |
All drilling has been mud-rotary type conducted by contracted drill rigs. The drill rigs are truck mounted water-well style rigs rated to depths of 1000 to 1500 ft. Mud-rotary drilling employs a water-mud fluid system which is pumped down-hole through the drill-pipe, through the drill bit, then up and out of the hole via the annulus between the drill pipe and the hole wall. The drill mud serves both to cool the bit and to flush the drill cuttings to the surface. The cuttings settle out of the mud system in dug mud-pits, from which the drill mud is subsequently pumped and recycled down the drill-pipe.
All holes drilled on the Property, without regard to purpose, are geophysically logged from surface to total depth. This logging is always done in the open, uncased hole status. Geophysical logs normally consist of an Electric Log (SP and Resistance) for lithologic interpretation, plus a Natural Gamma Log for detection of uranium mineralization. Geophysical logging may also include PFN logging of mineral intervals in selected holes (see also Section 11.0). Logging also includes deviation (drift) surveys reported at regular depth intervals, typically every 20 ft. All holes, to the greatest extent possible, are drilled vertically with a maximum of 2% vertical deviation (horizontal drift ÷ total depth) established as the goal. For this reason, and because mineralization occurs in a horizontal orientation, the mineral intercept thicknesses as reported by gamma logs are considered accurate representations of the true thickness of mineral. In addition, hole deviation is tracked and mapped routinely for consideration during geologic interpretation and resource estimation.
Drill cuttings are collected to correspond to every five feet of drilling. Cuttings are used to confirm lithology interpreted from drill logs and to identify the alteration status (redox) of the stratigraphic horizons, but are not analyzed chemically. Coring is done only on a very limited basis and only in selected intervals for the purpose of collecting undisturbed samples for various types of analyses.
10.2 Drilling - Lost Creek Project:
At the Lost Creek Project a total of 1,255 plug holes, 290 monitor wells, 9 water wells and 914 pattern wells have been drilled by URE since acquiring the Project and through August 31, 2013 (Table 4). Wellfield development drilling is currently on-going.
The drilling activities at the Lost Creek Project since acquisition have focused on the following goals:
| · | Delineation of resources in proposed production areas in order to facilitate wellfield planning and permitting. |
| · | Support the permit application processes by means of installing baseline sampling wells, pump-test wells, wellfield perimeter and interior monitor wells, and other monitor wells. |
| · | Install production pattern wells in Mine Unit 1. |
| · | Install monitor wells in Mine Unit 2. |
| · | Only a relatively minor amount of exploration drilling (159 holes) has been conducted on the Project. Most of this was done to test local extensions of the MMT, as discussed in Section 9.1. |
| 43 |
Significant drilling accomplishments since URE acquired the Project in 2005 and through August 31, 2013 include:
| · | Installation of baseline monitors, interior monitors, and pump test wells required for permit applications: |
Starting in 2006, a total of 210 monitor wells (excluding 23 abandoned wells) have been installed. These include regional baseline wells employed for baseline studies; wells monitoring the overlying, underlying, and production aquifers with relation to aquifer pump tests; and interior monitors within Mine Units 1 and 2. Efforts have focused on planned production from the HJ Horizon and future production in the KM Horizon.
| · | Full delineation of Mine Unit 1: |
Drilling between 2007 and 2010 fully delineated resources within Mine Unit 1. Approximately 450 holes on roughly 100 ft. spacing were drilled to define resources in both the HJ and KM Horizons. Production wellfield planning was completed based on the delineation results. Delineation was completed in late 2012 with the drilling of 10 holes on the western end of Mine Unit 1.
| · | Installation and testing of the perimeter monitor well rings around Mine Units 1 and 2: |
As part of the 2008 drilling, 28 perimeter monitor wells were completed within the production aquifer surrounding Mine Unit 1. Pump tests confirming proper communication between the monitors and the production zones were completed. Similarly a total of 31 perimeter monitor wells were installed in proposed Mine Unit 2 in the spring of 2013.
| · | Installation of Mine Unit 1 Production Pattern Wells (on-going): |
Progress to date (through August 31, 2013) includes:
| o | A total of 1036 pilot holes have been drilled as the first stage of well installation ahead of the casing stage. This represents approximately 99% of those planned for the Unit. Of that number, 914 were subsequently cased as pattern wells. The remaining 122 pilot holes were unsuitable for casing for various reasons. These are classified as PNC holes (Pilot Not Cased) and were permanently plugged and abandoned. |
| o | Of the 914 cased pattern wells a total of 681 (76%) have been advanced to the full completion stage. The remainder require additional efforts. A total of 30 of the cased wells to date failed to pass mechanically integrity testing. They were subsequently plugged and abandoned and replaced. |
| · | Delineation of approximately 70% of proposed Mine Unit 2: |
| o | Approximately 294 delineation holes were drilled as part of the 2008 drilling campaign. |
| o | An additional 133 delineation holes were drilled in late 2012 and early 2013 in a limited campaign. The main goal focused on definition of the outer limits of potentially minable mineral in the HJ Horizon in order to facilitate the design and installation of the perimeter monitoring ring for MU2. As such, delineation of resources took a secondary role and thus the addition of resources attributable to this activity was minimal. |
| o | Investigation of KM mineralization in the vicinity was also a secondary purpose of the 2012-2013 campaign. The outcome successfully recognized sufficient mineral in the KM to consider it a potential target for production. These resources are now allocated to new Resource Area 12 (RA12). |
| 44 |
| · | Drilling of the first two deep disposal wells: |
The first of up to five permitted deep disposal wells (LC DW #1) was drilled to a total depth of 9,997 ft. in December 2008 and subsequently cased after favorable test results were received. In May 2010, the well was successfully permitted as a Class I Underground Injection Well. The second deep disposal well (LC DW #4) was drilled in November, 2012 to a total depth of 8700 ft. Formation testing was completed and submitted for final permitting of LC DW #4 and the permit is in the final approval stages by state and federal agencies. Surface injection equipment is on site and will be installed in 2013.
| · | First stage exploration of the northeastern portion of the Lost Creek Project (Section 16): |
Potential easterly extensions of the MMT were identified with the drilling of 50 exploration holes during 2011 drilling.
10.3 Drilling - LC East Project:
Drilling activities by URE through August 31, 2013 include:
| · | Drilling of 164 delineation holes during the summer of 2012 in the southern portions of the EMT. The primary goal of this campaign was to test for extensions of mineral trends identified by historical drilling activities. In addition, 16 wide-spaced stratigraphic control holes were drilled to provide information relevant to permitting activities. The drilling delineation drilling campaign successfully extended several mineral trends and increased resources in the Measured plus Indicated category by 1.5% and by 88% in the Inferred category (see Section 14.5). |
| · | Installation of 26 Baseline Monitor and Pump Test wells. These are for baseline sampling and regional pump tests needed for permitting. |
10.4 Drilling - Other Adjoining Projects:
No drilling activities were conducted within the LC West, LC North, LC South and EN Projects since the April 30, 2012 PEA other than the installation of a water well in the northern portion of LC South for the purpose of supplying water for the LC East drilling activities.
All past drilling in the Adjoining Projects by URE since acquisition of these projects has been for the purpose of exploration, as discussed in Section 9.2. All of this drilling, with the exception of water supply wells, has been plug drilling employing the same methods and procedures described for the Lost Creek Project. Statistical summaries of the drilling for the Lost Creek Project and individual Adjoining Projects are given in Table 4.
Of the drilling activities at Lost Creek and LC East described above, the following were accomplished since the April 30, 2012 PEA:
Lost Creek:
| · | Installation of production Pattern Wells in Mine Unit 1 (on-going): 914 wells, through August 31, 2013. |
| · | Delineation drilling in MU2 (RA 2): 133 holes (includes 2 cored delineation holes), |
| · | Delineation drilling in MU1 (RA1): 10 holes, at the western end of MU1. |
| · | Installation of all Perimeter and Interior Monitor wells for MU2 (former RA2): |
80 wells.
| 45 |
LC East:
| · | Delineation drilling: 164 holes. |
| · | Stratigraphic exploration drilling: 16 holes |
| · | Installation of Baseline Monitors and Pump Test wells: 26 wells (excluding 5 failed wells plugged and abandoned) |
| 11.0 | Sample Collection, Preparation, Analysis and Security |
All mineralization at the Lost Creek Property occurs at depth and does not outcrop. Therefore, testing of the mineralization is accomplished solely by means of drilling. Similarly, virtually all testing of mineralization, or “sampling,” is accomplished by one or more of three methods derived from the drilling activities:
| 1. | Down-Hole Gamma Logs: This method is the most common and provides information of mineralization. Every hole drilled on the Property is gamma logged. Gamma logging is an indirect measurement of uranium content. |
| 2. | PFN (Prompt Fission Neutron) logging of selected mineralized intervals. This method provides a direct downhole measurement of uranium content as a supplement to, and confirmation of, gamma measurements |
| 3. | Coring: Only a small percentage of drilled holes are cored. Laboratory analyses of core provide information on mineralization and physical and chemical properties of the host formation. |
Down-hole Geophysical Logging: Every hole completed on the Property by URE and its predecessors has been geophysically logged using a down-hole electronic probe. URE geophysical logging data have been obtained using a Company owned and operated logging unit which employs technology from GeoInstruments, Inc. of Nacogdoches, Texas; and also from a qualified independent contractor, Century Geophysical of Tulsa, Oklahoma. Down-hole measurements include gamma logs, single-point resistance, spontaneous potential (SP), and hole deviation.
Gamma logs provide data that is an indirect measurement of uranium content in the host rock. Gamma radiation measurements are collected in one-tenth foot depth intervals. A U.S. Department of Energy (DOE) algorithm is used by the logging unit software to convert the gamma ray readings, measured in counts per second (CPS), into grade reported as equivalent percent uranium (% eU3O8). The results are reported in one-half foot increments. Mineralized intervals (intercepts) are then defined by applying pre-established grade cutoffs to report:
| · | Thickness of each mineralized zone (ft.). Mineralized thickness from gamma logs is considered an accurate representation of the true thickness because the strata are essentially horizontal and drill holes are virtually vertical. |
| · | Average Grade within each thickness interval (% eU3O8); |
| · | Depth (bgs) to the top of the intercept (ft.) |
| · | GT: Calculated as the average grade multiplied by thickness (%ft.) for each intercept interval (usually expressed without units). |
Throughout the history of the Property, various minimum grade cutoffs have been applied to define mineral intercepts for resource estimation. Historical activities targeted resources for conventional mining techniques and generally used a 0.030% or 0.025% grade cutoff. Earlier URE resource estimates also used a 0.030% cutoff. However, resource estimates beginning with the March 2011 PA have employed mineral intercepts reported at the 0.020% cutoff, recognizing that ISR mining is much less sensitive to grade than conventional mining (see Section 14.2). The GT cutoff has remained consistent at 0.30 GT throughout URE activities.
| 46 |
Quality control on the logging unit is performed by calibration of the logging unit at the Casper, Wyoming DOE test pit (known source concentration) no less than once a month. Calibration is performed using industry established procedures. URE maintains detailed calibration records. Logging contractors employed by URE are required to calibrate in the same fashion and on a similar schedule. Additionally, the reliability of URE’s gamma tool has been tested by repeat logging of several holes multiple times; and by duplicate logging of several holes which were also logged by independent contractors.
PFN Logging: PFN is considered a direct measurement of true uranium concentration (% U3O8) and is used to verify the grades of mineral intercepts previously reported by gamma logging. PFN logging is accomplished by a down-hole probe in much the same manner as gamma logs, however only the mineralized interval plus a buffer interval above and below are logged. After review of the gamma log from each drill hole, the URE field geologists determine if any intercepts warrant PFN logging, based on the GT of the gamma intercepts (GT ≥ 0.10). If selected by the field geologist and if the PFN tool is available within a reasonable timeframe, the hole will be logged by PFN. As such, the PFN results are employed only as a confirmation of gamma derived results, but not as a complete replacement or duplication of them. Approximately 9.3% of all holes drilled by URE on the Lost Creek Property have been PFN logged. Quality control for the PFN is performed at the DOE test pit in a manner similar to that described above for the gamma tool.
Core Samples: Core samples have been obtained from approximately 2% of the holes drilled by URE at the Lost Creek Property. Core holes are located as close offsets of previously drilled holes which showed mineral intercepts of interest. Select intervals within holes of interest are cored by means of a mud-rotary drill-rig employing a 15-ft long, split-tube core barrel. Core recovery has been approximately 95%. Core is described in detail and photographed in the field. Additionally, the core is scanned in the field on one-half foot intervals with a hand-held scintillometer to identify sections of higher radioactivity for sampling. The scintillometer results are also employed to provide a detailed depth correlation and comparison between the gamma log and core depths provided by the driller. Depth correlation accuracy of less than one-half foot is normally obtained. The core is then vacuum sealed in plastic bags. Samples selected for laboratory analyses are later cut in one foot intervals, split by hand longitudinally and bagged by URE employees for shipping. Analysis has been conducted by qualified laboratories for uranium content (discussed below). In addition, selected samples are tested for density, permeability and other physical features, as well as leach amenability. Samples for leach testing are vacuum sealed again immediately after selection and prior to shipping to the lab.
Drill Cutting Samples – During drilling of all holes, cuttings are collected at five-foot intervals. Detailed descriptions of each of these samples are then documented by the field geologists. Drill cutting samples are valuable for lithologic evaluation and also for description of redox conditions, based on sample color. However, these samples are not analyzed for uranium content because there is considerable dilution and mixing which occurs as the cuttings are flushed to the surface. In addition, the samples are not definitive with regard to depth due to variation in the lag time between cutting at the drill bit and when the sample is collected at the surface.
| 47 |
Sample Preparation, Analyses, and Security - After collection and documentation in the field, cores and other physical samples derived from URE’s drilling activities at the Property were delivered to Energy Laboratories, Inc. (Energy), an independent commercial laboratory in Casper, Wyoming. Energy has been performing uranium analyses and testing for over 30 years and is considered by Mr. Cutler to be qualified to secure, handle and analyze samples in accordance with industry standards. Energy has an industry-standard internal QA/QC system including routine equipment calibration and the use of standards, blanks, duplicates and spikes. Testing of physical properties (porosity, permeability) have also been performed by Maxim Technologies of Billings, Montana and Weatherford Laboratories of Casper, Wyoming (Weatherford, 2010). Hazen Research, Inc. (Hazen Research) and Assayers Canada LTD (now SGS) performed analyses of duplicate samples.
Data from historical sampling, prior to URE, were derived by reputable exploration companies and are assumed to have been collected, secured and analyzed in accordance with standard industry practices at the time. More recent data have been validated by calibration of down-hole gamma and PFN comparison against laboratory assay results, as described in the prior Section. The calibration confirmed the ability to appropriately use the down-hole data for resource estimate calculations.
Mr. Cutler has reviewed URE Standard Operating Procedure documents and guidelines and found them to be consistent with industry practice. He is of the opinion that the sampling, analyses, and security relevant to the data used in the present resource estimate have been performed to standard industry practices and are acceptable and appropriate for use in the resource estimate.
| 12.0 | Data Verification |
Data supporting this Preliminary Economic Assessment comes almost exclusively in the form of drill data gained from historical drilling activities by previous operators and those conducted by URE since acquisition of the Property. Quality control of URE drill data has been discussed in Section 11.0. The tabulations of mineral intercepts compiled by URE have been confirmed by Mr. Cutler to be consistent with the original down-hole electric logs and the geophysical operator’s mineral intercept calculations.
URE has verified historical drill data by conducting confirmation drilling and coring in the Lost Creek Project adjacent to selected historical exploration holes with results which validate the historical data. In addition, several historical drill holes have recently been re-entered and re-logged with the gamma tool for comparison to the initial historical gamma logs. In all cases the repeatability of the data was within approximately 10%. Furthermore, mineral intercept data of previous operators in all Projects have been evaluated and selectively checked for accuracy by re-calculation of grade and thickness using standard methods established by the U.S. Atomic Energy Commission (AEC). Review of that data has concluded that the historical mineral intercept data is valid and does not require re-calculation. Mr. Cutler has compared the historical drill log mineral values to the URE tabulations and confirmed the validity and accuracy of the procedure.
The historical drill data supporting Adjoining Projects is derived from the same large regional historical drill database which covers the Lost Creek Project. That database was a part of the acquisition of NFU Wyoming, LLC in 2005, in which the Company acquired the Lost Creek Project. Extensive drilling by URE in the Lost Creek Project over the years has confirmed the validity of the database within that Project, as discussed above. Therefore, it is reasonable to assume that the same historical data, derived from the same operators, is accurate and valid within the Adjoining Projects as well.
| 48 |
In the LC East Project, URE possesses gamma logs for virtually every historical drill hole (approximately 1,063 holes). Mineral data employed in the current LC East resource estimates have been collected from varied historical sources in URE’s data files, mainly: 1) historical drill hole maps with mineral intercept values (most abundant source) and 2) grade calculation sheets within drill hole file folders. Where such information was not available, mineral intercept values were calculated from the gamma logs by URE geologists using the standard AEC calculation method mentioned above and employing a grade cutoff of 0.020%. In addition, numerous historical mineral intercepts were re-calculated by URE geologists for confirmation of that data. In total, approximately 17% of all mineral intercepts within the LC East Project have been calculated by URE geologists. A statistical comparison of URE calculated mineral intercept values to historical mineral intercept values yielded an average variance of 8.6%. Mr. Cutler considers this to be adequate for an accurate estimation of resources. Therefore, the current resource estimation remains based largely on historical mineral intercept data supplemented with recent data derived from URE drilling in 2012. Where available, the values recently calculated by URE replaced the historical mineral intercept values. URE plans to continue recalculation of all mineral intercepts within the LC East Project.
As a Qualified Person, Mr. Cutler is of the opinion that the quality of the data is acceptable for use in this Preliminary Economic Assessment.
| 13.0 | Mineral Processing and Metallurgical Testing |
Mineral processing tests were performed on four sets of core samples, beginning in 1979 by Texasgulf. These tests, using bicarbonate lixiviant, resulted in extractions ranging from 60 to 75%, while column tests resulted in extractions from 38 to 80% with six of the seven tests between 64 and 80% extraction. However, these tests were related to hours of leaching rather than pore volumes, as is currently standard.
The next tests were conducted by Wyoming Mineral Corporation in 1981, and these tests indicated 81% U3O8 extraction for agitation leach tests and 89% for columns. Because the sample was partially oxidized prior to the test, the results should not be relied upon (Roscoe Postle Associates, 2006).
Tests were conducted more recently for URE in 2005 and 2007 by Energy Laboratories. The leach tests in 2005 employed five pore volumes in a bottle roll test with a lixiviant of two grams per liter of NaHCO3 and 500 milligrams per liter of H2O2. The leach tests demonstrated an average recovery of 82.8%.
Table 6 presents a summary of the 2005 leach test results.
The 2005 leach testing investigated selected one-foot intervals within any given mineralized zone rather than a composite of the entire mineral intercept for each hole. These discrete drill hole intervals demonstrate the range of leaching characteristics shown above. The average recovery is calculated at 82.8% with a range of 59.4 to 92.8%.
| 49 |
The sample tested from drill hole LC8C-18 was relatively high grade (0.480% eU3O8) which is about ten times the grade typically observed in the deposit. It can be seen that the recovery for this sample is rather low (59.4%). The concentration of uranium recovered in the last pore volume was 68.4 milligrams per liter, so additional pore volumes of lixiviant likely would have continued to extract uranium and enhance the recovery estimate. The ultimate recovery, however, cannot be predicted. It can be seen that this principle applies to other samples that were leached. The conclusion is that the samples can be leached with a significant portion of the uranium, about 83%, being leached from the samples.
Table 6: Leach Test Results, 2005
| Sample ID | Solution Base |
Bicarbonate (NaHCO3) Concentration (g/L) |
Peroxide (H2O2) Concentration (g/L) |
Uranium Recovery % |
Average Solution Concentration (mg/L U) |
| LC7C – 19 | NA | 2.0 | 0.5 | 87.5 | 83.9 |
| LC7C – 19 | NA | 2.0 | 0.5 | 90.3 | 139.0 |
| LC8C – 18 | NA | 2.0 | 0.5 | 59.4 | 628.1 |
| LC9C – 18 | NA | 2.0 | 0.5 | 75.0 | 90.2 |
| LC10C – 18 | NA | 2.0 | 0.5 | 92.8 | 229.9 |
| LC11C - 20 | NA | 2.0 | 0.5 | 91.6 | 103.0 |
The test in 2007 had the objective of analyzing several lixiviant combinations to provide information on uranium recovery relative to the various lixiviants. The work was performed on samples from Core Hole LC-66C, using the 412 to 420.4 foot interval for compositing and leaching, with grades determined by chemical and radiometric analysis. The moisture in the sample was determined to be 8.53% and the metals content is shown in the Table 7. Dry bulk densities were assumed to be 2.0 grams per cubic centimeter and to have 30% porosity.
Table 7: Metal Values from Core Samples
| Analyte | mg/kg |
| Arsenic | 2.1 |
| Molybdenum | ND (a) |
| Selenium | 25.5 |
| Sulfate | 1,740 |
| Sulfur | 581 |
| Uranium | 513 |
| Uranium, U3O8 | 605 |
| Vanadium | 7.6 |
| (a) ND = Not Detected |
Seven bottle roll tests were conducted at ambient pressure and were not designed to approximate in situ conditions, but are only intended to be indicative of the reaction rate. Table 8 presents the combination of lixiviants that were evaluated and are shown with the recovery results for the 2007 leach tests after 30 pore volumes, in five pore volume increments. The variables in the lixiviants were bicarbonate concentration and oxidant (peroxide) strength using ambient groundwater, except for two tests conducted with laboratory grade water. The individual leach periods were 16 hours each.
| 50 |
Table 8: Bottle Roll Leach Test Results, 2007
| Sample ID | Solution Base | Bicarbonate (NaHCO3) (g/L) |
Peroxide (H2O2) (g/L) |
Uranium Recovery % |
Average Solution Concentration (mg/L U) |
| LC 2007-01 | Groundwater | Natural | 0.25 | 34.9 | 51.3 |
| LC 2007-02 | Groundwater | 1.0 | 0.25 | 84.1 | 127.6 |
| LC 2007-03 | Groundwater | 1.5 | 0.25 | 91.6 | 139.6 |
| LC 2007-04 | Groundwater | 2.0 | 0.25 | 94.5 | 147.0 |
| LC 2007-05 | Groundwater | 2.0 | 0.50 | 94.4 | 147.7 |
| LC 2007-06 | Synthetic Water | 2.0 | 0.25 | 95.7 | 150.1 |
| LC 2007-07 | Synthetic Water | 2.0 | 0.50 | 94.9 | 151.1 |
These results show that the core is leachable at the lixiviant concentrations shown above, under ambient laboratory conditions.
In 2010, URE performed leach testing on samples from the KM Horizon. Those results are presented in Table 9. Seven samples obtained from one-foot sections of core were tested for mineral recovery using the same test methods as described above at Energy Laboratories. Twenty-five pore volumes of bicarbonate leach solution were passed through the samples. Uranium recovery ranged from 54.1 to 93.0% with an average uranium recovery of 80.6%.
Table 9: KM Horizon - Leach Test Results, 2010
| Sample ID |
Solution Base | Bicarbonate (NaHCO3) (g/L) |
Peroxide (H2O2) (g/L) |
U Recovery % |
Average Solution (mg/L U) |
| LC46-01 | Groundwater | Natural Bicarb | 0.25 | 54.1 | 42.0 |
| LC46-02 | Groundwater | 1.0 | 0.25 | 87.2 | 78.8 |
| LC46-03 | Groundwater | 1.5 | 0.25 | 87.7 | 84.6 |
| LC46-04 | Groundwater | 2.0 | 0.25 | 89.0 | 84.8 |
| LC46-05 | Groundwater | 2.0 | 0.50 | 93.0 | 92.6 |
| LC46-06 | Synthetic Water | 0.5 | 0.50 | 74.0 | 66.3 |
| LC46-07 | Synthetic Water | 1.0 | 0.50 | 88.0 | 81.0 |
These tests demonstrate the likely amenability of the mineralized zones to in situ recovery.
URE is not aware of any historical metallurgical testing having been done within lands acquired in 2012 through the AEA and New Claims. No metallurgical testing has been done for the Lost Creek Project since the April 30, 2012 PEA.
| 51 |
| 14.0 | Mineral Resource Estimates |
Cautionary statement: this Preliminary Economic Assessment is preliminary in nature, and includes inferred mineral resources that are considered too speculative geologically to have the economic considerations applied to them that would enable them to be categorized as mineral reserves. The estimated mineral recovery used in this Preliminary Economic Assessment is based on site-specific laboratory recovery data as well as URE personnel and industry experience at similar facilities. There can be no assurance that recovery at this level will be achieved.
The mineral resources for the Property reported here have been estimated utilizing the grade-thickness (GT) contour method. The GT contour method is well accepted within the uranium ISR industry and is suited to guide detailed mine planning and estimates of recoverable resources for roll front type deposits such as the Lost Creek Property. A discussion of the methodology is presented below in Section 14.4. See also the notes below Tables 1 and 10.
Resource estimation for the Lost Creek Property does not include mineralization above the static water table as such mineralization is not amenable to in-situ recovery.
| 14.1 | Resource Classification |
Resource estimates were prepared using parameters relevant to the proposed mining of the deposit by ISR methods. The methodology relies on detailed mapping of mineral occurrences to establish continuity of intercepts within individual sandstone host units. This method is more regimented and results in a more detailed analysis than methods utilized by URE during earlier stages of property evaluation (prior to TREC, 2011). The mineral resource estimates in this report were reviewed and accepted by the Qualified Person, Mr. Steve Cutler.
URE employs a conservative resource classification system which is consistent with standards established by the CIM. Mineral resources are identified as Measured, Indicated and Inferred based ultimately on the density of drill hole spacing, both historical and recent; and continuity of mineralization within the same mineral horizon (roll front).
In simplest terms, to conform to each classification, resources determined using the GT contour method (see Section 14.4) must meet the following criteria:
| 1. | Meet the 0.02% grade cutoff |
| 2. | Occur within a contiguous mineral horizon (roll front) |
| 3. | Fall within the 0.30 GT contour and |
| 4. | Extend no farther from the drill hole than the radius of influence specified below for each category. |
Employing these considerations, mineral which meets the above criteria is classified as a resource and assigned a level of confidence via the following drill spacing guidelines:
Measured:
| ≤100 ft. | (i.e., mineral on trend, within the 0.30 GT contour, and which does not extend beyond 100 ft. from any given “ore-quality” drill hole) |
Indicated:
| 100 - 200 ft. | (i.e., mineral on trend, within the 0.30 GT contour, and which extends from 100 ft. to 200 ft. from any given “ore-quality” drill hole) |
| 52 |
Inferred:
| 200 - 400 ft. | (i.e., mineral on trend, within the 0.30 GT contour, and which extends from 200 ft. to 400 ft. from any given “ore-quality” drill hole) |
Mineral occurring more than 400 ft. beyond any given “ore-quality” drill hole is considered mineral potential and given no resource value.
Isolated occurrences of mineral meeting the GT and grade cutoff criteria (i.e., single isolated “ore-quality” drill holes) are classified as Inferred, and are defined as mineral which occurs within the 0.30 GT contour for the given mineral horizon and extending no more than a 400 foot beyond the sample point (drill hole). See Section 14.4 Methodology for additional discussion.
| 14.2 | Cutoff Selection |
Mineral reportable as resources must be below the static water level and meet the following cutoff criteria (see also Section 14.4):
Minimum Grade: 0.020%
eU3O8
Grade measured below this cutoff is considered as zero value.
Minimum GT (Grade x Thickness):
0.30
Intercepts with GT values below this cutoff are mapped exterior to the GT contours employed for resource estimation, given zero
resource value and therefore are excluded from reported resources.
Minimum Thickness: No minimum thickness is applied, but is inherent within the definition of GT.
The cutoffs used in this report are typical of ISR industry practice and represent appropriate values relative to current ISR operations. ISR extraction is considerably less sensitive to mineral grade than conventional mining methods. Experience at other ISR operations have demonstrated that grades below 0.020% can technologically be successfully leached and recovered, given supporting economics. Due to the nature of roll front deposits and production well designs, the incremental cost of addressing low grades is minimal (given the presence of higher grades). Furthermore, a GT cutoff of 0.30 is representative of past ISR operations in similar geologic and economic conditions. Note, however, that the above cutoffs were selected without direct relation to any associated commodity price. Definition of the term “ore-quality” as applied by URE is subjective and employed simply to identify higher quality mineral which could potentially be pursued for production.
| 14.3 | Assumptions |
Resources within the Lost Creek Property are identified recognizing that roll front mineralization occurs in long, narrow, sinuous bodies which are found adjacent and parallel to alteration (redox) fronts. These commonly occur in multiple, vertically stacked horizons, each of which represents a unique resource entity. Resource classification requires horizontal continuity within individual horizons. Accumulation of resources in a vertical sense (i.e., accumulating multiple intercepts per drill hole) is not valid in ISR applications. Individual roll front mineral horizons are assumed to be 50 ft. wide (based on project experience) unless sufficient information is available to establish otherwise.
In addition, certain assumptions were incorporated throughout all calculations:
| 1. | No disequilibrium. Therefore, the radiometric equilibrium multiplier (DEF) is 1.0. |
| 53 |
| 2. | The unit density of mineralized rock is 16.6 cubic ft. per ton, based on numerous core density measurement results (Maxim Technologies Inc. / Tetra Tech, Inc., 2005a, 2005b, 2006). |
| 3. | All geophysical logs are assumed to be calibrated per normal accepted protocols, and grade calculations are accurate. |
| 4. | All mineral classified as a resource occurs below the static water table. |
| 14.4 | Methodology |
Fundamentals
The Property resources are defined by utilizing both historical and recent drilling information. The basic unit of mineral identity is the “Mineral Intercept” and the basic unit of a mineral resource is the “Mineral Horizon”, which is generally synonymous to a roll front. Mineral intercepts are assigned to named mineral horizons based on geological interpretation by URE geologists founded on knowledge of stratigraphy, redox, and roll front geometry and zonation characteristics. Resources are derived and reported per mineral horizon (i.e., per roll front). In any given geographic area, resources in multiple mineral horizons may be combined into a “Resource Area” (further defined in Section 16.2).
Mineral Intercepts
Mineral intercepts are derived from drill hole gamma logs and represent where the drill hole has intersected a mineralized zone. Calculation of uranium content detected by gamma logs is traditionally reported in terms of mineral grade as eU3O8% (equivalent uranium) on one-half foot depth increments. A mineral intercept is defined as a continuous thickness interval in which mineral concentration meets or exceeds the grade cutoff value, which is 0.02% for the Lost Creek Property. Mineral below the cutoff grade is treated as zero value with regard to resource estimation. A mineral intercept is defined in terms of:
| · | Thickness of the mineralized interval that meets cutoff criteria |
| · | Average Grade of mineral within that interval |
| · | Depth (bgs) to the top of that interval |
In addition, a GT value is assigned to each mineral intercept, defined as the average grade of the intercept times the thickness of the intercept. GT is a convenient and functional single term used to represent the overall quality of the mineral intercept. It is employed as the basic criterion to characterize “ore-quality”, which at the Lost Creek Property is defined as GT ≥ 0.30. Intercepts which do not make the “ore–quality” GT cutoff are excluded from the resource calculation, but may be taken into consideration when drawing GT contours. As noted above, use of the term “ore-quality” by URE is applied in a generic sense and has no direct relation to any associated commodity price.
Each intercept is assigned to a stratigraphic and mineral horizon (Figures 6 and 8) by means of geological evaluation. The primary criterion employed in assignment of mineral intercepts to mineral horizons is roll front correlation. Depth and elevation of intercepts are secondary criteria which support correlation. The evaluation also involves interpretation of roll front zonation (position within the roll front) by means of gamma curve signature, redox state, lithology and relative mineral quality (Figure 7). Mineral intercept data and associated interpretations are stored in a drill hole database inventoried per drill hole and mineralized horizon. Using GIS software, this database is employed to generate map plots displaying GT values and interpretive data for each mineral horizon of interest. These maps become the basis for GT contouring as described below.
| 54 |
GT Contouring and Resource Estimation
For the map plots of GT values mentioned above, the GT contour lines are drafted honoring all GT values. Contours may be carefully modified by URE geologists where justified to reflect knowledge of roll front geology and geometry. The GT contour maps thus generated for each mineral horizon form the foundation for resource calculation. In terms of geometry, the final product of a GT contoured mineral horizon typically represents a mineral body that is fairly long, narrow, sinuous, and which closely parallels the redox front boundary. Parameters employed to characterize the mineral body are:
| Thickness: | Average thickness of intercepts assigned to the mineral horizon (inherent in GT values) |
| Grade: | Average grade of mineral intercepts assigned to the mineral horizon (inherent in GT values) |
| Depth: | Average depth of mineral intercepts assigned to the mineral horizon |
| Area: | Defined as the area interior to the 0.30 GT contour lines, more specifically: |
Width: Defined by the breadth of the 0.30 GT contour boundaries. Where sufficient data are unavailable, (i.e., wide-spaced drilling), the width is assumed to be no greater than 50 feet
Length: Defined by the endpoints of the 0.30 GT contour boundaries. Where sufficient data is unavailable, length is limited to 800 feet (i.e., 400 feet on either side of an isolated drill hole – Inferred resource category).
For resource estimation the area of a mineral horizon is further partitioned into banded intervals between GT contours, to which the mean GT of the given contour interval is applied. Area values for each contour interval are then determined by means of GIS software. Once areas are derived and mean GT values are established for each contour interval, resources are then calculated for each contour interval employing the following equation. Resources per contour interval are then compiled per mineral horizon and per mineral ‘pod’ as discussed below.
POUNDS = AREA x GT x 20 x DEF
TF
Where:
| POUNDS | = Resources (lbs.) | |
| AREA | = Area measured within any given GT contour interval (ft2) | |
| GT | = Mean GT within any given contour interval (%-ft.) | |
| 20 | = Conversion constant: tons to unit lbs. (1% of a ton) | |
| DEF | = Disequilibrium factor (=1.0 no disequilibrium) | |
| TF | = Tonnage Factor: Rock density, a constant (=16.6 ft3/ton). | |
| Enables conversion from volume to weight. |
In map-view resources for any given mineral horizon often occur in multiple ‘pods’ rather than a single continuous body. Individual pods are then compiled per mineral horizon, summed and categorized by level of confidence (Measured, Indicated, or Inferred) using the criteria discussed in Section 14.1. The resource calculation process is streamlined using the same GIS software in which the mapping and GT contouring took place.
As is evident, the GT contour method for resource estimation is dependent on competent roll front geologists for accurate correlation and accurate contour depiction of the mineral body. Nonetheless, uranium industry experience has shown that the GT contour method remains the most dependable for reliable estimation of resources for roll front uranium deposits.
| 55 |
Note that estimation of rock tonnage does not play a significant role in the resource assessment for ISR applications. This is because the ISR extraction process does not require rock to be physically transported and therefore this aspect is not significantly pertinent to ISR mining economics.
The increase in resource is attributable to the increased drill density from production well installation. Increased drill density has resulted in better definition of the highly sinuous nature of the mineralized frontal systems. More and tighter sinuosity yields greater roll front length, and subsequently an increase in the area applied to the resource calculations, resulting in more pounds. Also, the increased drill density results in more drill holes penetrating the “spine” of the roll fronts where the highest grade occurs (see Figure 7), increasing the overall average grade. Likewise, higher grade results in more pounds.
Figure 9 illustrates the outlines of mineral occurrences in the Lost Creek Property defined by the 0.30 GT contours. Figures 10a and 10b are cross sections that illustrate the mineralization and strata in the Lost Creek and LC East Projects and are representative of the entire Property.
| 14.5 | Resource Estimation Auditing |
As an additional audit of resource modeling methods for the Lost Creek Property all the data for this project was loaded into Vulcan software by Mr. Steve Cutler. The resource shapes were originally AutoCad .dxf files and the drill hole data was stored in an Access database. The resource shapes were directly imported into Vulcan. Data from the Access drill hole database was exported to Excel where it was then formatted for Vulcan and saved as a .csv file that was used for the Vulcan import.
Resource Polygon Checking
A total of 22 resource polygons were audited for this project. In the main Lost Creek, 13 polygons were evaluated. LC East, LC North, and LC South each had 3 polygons evaluated. Fewer polygons were evaluated in the outlying zones due to more widely spaced drilling and less certainty. The polygons were selected to represent a variety of complexity. Each selected polygon had several drill holes influencing the shape
Using Vulcan, each drill hole influencing the shape of the selected polygon was located and labeled with its Hole ID. Any hole within 50 feet of the polygon was defined to have influence. These holes were located by either offsetting the polygon or drawing a circle with a 50 foot radius at the extremity of the polygon, then viewing in Vulcan which collars fell within the 50 foot zone. In the main Lost Creek area, the surveyed collar deviation layer was used to determine the location of the hole
The gamma or PFN data for each hole with influence on the resource polygon was then compiled into an Excel spreadsheet. This allowed for several cross-checks between the contours and the actual intercept values in the drill holes. Each hole was reviewed to ensure that grade thickness values were within the correct contours, that only resource grade material was included in the polygons, that the redox front was honored, and that the shape of the polygon corresponded with the drill hole collar locations.
| 56 |
Resource Pounds Checking
For each polygon, the pounds reported as resource were also checked. This was done by calculating the square footage for each polygon in Vulcan. If the shape was more complex, with several grade contours, the square footage within each contour was calculated. The square footage from Vulcan was then cross-referenced to the square footage used by URE in their resource calculation to ensure that all areas were correct. Volume and the number of pounds per polygon were then calculated using the same average GT as was used in the URE resource calculation. For the highest contour interval in the polygon, the average GT used was checked against the drill hole intercepts falling within that contour to ensure that the average of those intercepts was the average used for the calculation. The resultant resource values for the polygons were comparable to those derived by URE.
Quality Control/Quality Assurance Review
The URE quality control program was reviewed to ensure proper handling of samples as well to ensure that blank and duplicate samples are being taken. URE provided documentation showing that both blank and duplicate samples are taken on a regular basis and that the results are as expected. The standard procedure for collecting and handling samples maintains the integrity of the sample and samples are being handled properly with chain of custody documented.
Two drill holes were reviewed in detail to compare gamma, PFN, and lab (core) results. The drill holes LC432C and LC450C both demonstrated very comparable results between all three methods. Ratios of PFN grade vs. lab (core) grade were acceptable.
CIM Compliance
Lost Creek resources were classified as Measured, Indicated, and Inferred based on drill spacing. Audited polygons were correctly classified based on drill spacing. Only areas with mineralized drill holes within 100 feet of each other and on the same horizon were classified as Measured, those within 200 feet of each other were classified as indicated and those within 400 feet were inferred.
The most recent and all relevant data was used in the calculation of this mineral resource.
| 14.6 | Summary of Mineral Resources |
Mineral resources are summarized in Table 1 and also in Table 10 where they are listed by Project and mineral horizon. Figure 9 illustrates the location of resources as defined by outlines of the 0.30 GT contour mineral ‘pods’ and trends for the Property. The current mineral resource estimate for the Lost Creek Property is 8.655 million lbs. in the Measured and Indicated categories with an additional 4.740 million lbs. in the Inferred category. In general, the current resource estimate represents a total increase to the Lost Creek Property (all Projects) of 307 thousand lbs. in the Measured plus Indicated categories and 1.870 million lbs. in the Inferred category when compared to the previous estimate in the April 30, 2012 Preliminary Economic Assessment. This represents a 4% and 65% increase in the respective categories. These increases to the total Property resource are attributed mainly to additional resources identified during Mine Unit 1 wellfield installation, new resources identified by delineation drilling in the LC East Project and re-assessment, and slight modification of resource estimation criteria driven by positive results from MU1 drilling. The average grade of the new resources is much the same as previously identified resources, as is reflected in Table 10.
| 57 |
Lost Creek Project:
Revisions to the resource estimate for the Lost Creek Project since the April 30, 2012 PEA result from wellfield installation drilling in Mine Unit 1 (formerly RA1), from delineation drilling in MU2 (formerly RA2), and slight modification of resource estimation criteria driven by positive results from MU1 drilling. Updated resources are listed in Tables 1 and 10. Table 11 identifies resources assigned by Resource Area.
The current Mine Unit 1 resources are reported as 2.428 million lbs. all in the Measured category (Table 11). This represents a 40% increase of 672 thousand lbs. above the total reported in the April 30, 2012 PEA. This increase is attributable largely to the added data provided by the increased drill density from production well installation. Delineation drilling prior to wellfield development has been conducted on approximately 100 foot spacing and is the basis for initial wellfield resource estimates. When considering, however, that a roll front target at Lost Creek may be only 25 to 50 feet wide, this presents circumstances in which the presence of the mineral trend can be confirmed, but the sampling (drilling) may not test the richest portion of the roll front. Production well installation on the other hand is conducted on approximately 75 foot spacing and thus affords additional data at much closer spacing. The increase in drill density resulted in an increase in resources due to two reasons:
| 1. | Recognition that the roll fronts are considerably more sinuous and convoluted than can be recognized at 100 foot drill spacing. The increased sinuosity has the effect of increasing the linear dimension of the fronts and thus an increase in resources. |
| 2. | The closer drill density results in more drill holes penetrating the “spine” of the roll fronts where the highest grade occurs (Figure 7). This increases the overall average grade and GT, thus increasing resources. |
This addition of resources with more drilling demonstrates Ur-Energy’s conservative philosophy toward resource estimation.
With that experience gained, the resource estimation criteria were reviewed and revised slightly to attempt to provide future estimates which will be closer to that which eventually is placed into production. The changes are primarily interpretive and involve relaxing the criteria somewhat for the Inferred category. Using the revised criteria, the resources for all the projects were subsequently re-examined and revised where necessary.
The pilot hole drilling phase for well installation is currently complete in Mine Unit 1. As this is the phase providing mineral data, very little additional future data is anticipated from Mine Unit 1 and the current resource estimate reported here can be considered the final estimate for Mine Unit 1 prior to production.
In Mine Unit 2 (RA2) the total HJ Horizon resources are currently reported as 1.606 million lbs. in the Measured plus Indicated categories and 316 thousand lbs. as Inferred (Table 11). This represents a net decrease from that reported in the April 30, 2012 PEA. Resources in the Measured plus Indicated category have been decreased by 818 thousand lbs. (34%) due to more stringent interpretation in resource mapping for that Unit. Some of that loss involved merely downgrading and shifting into the Inferred category, which accordingly gained 316 thousand lbs.
Recent delineation drilling in Mine Unit 2 (RA2) also tested the underlying KM Horizon in that area. Results increased the Measured + Indicated resources by 69% to 435 thousand lbs. and increased the Inferred resources by 474% to 247 thousand lbs. The increase is sufficient to warrant designating the KM resources here as a new Resource Area: RA12.
| 58 |
Table 10: Lost Creek Property Resources, by Project
| MEASURED | INDICATED | INFERRED | |||||||||||
| HORIZON | AVG GRADE % eU3O8 |
SHORT TONS (X 1,000) |
POUNDS (X 1,000) |
AVG GRADE % eU3O8 |
SHORT TONS (X 1,000) |
POUNDS (X 1,000) |
AVG GRADE % eU3O8 |
SHORT TONS (X 1,000) |
POUNDS (X 1,000) | ||||
| LOST CREEK PROJECT | |||||||||||||
| UFG | 0.062 | 11 | 14 | 0.056 | 117 | 132 | 0.070 | 115 | 161 | ||||
| MFG | 0.043 | 15 | 13 | 0.087 | 1 | 1 | 0.031 | 55 | 34 | ||||
| LFG | 0.046 | 125 | 115 | 0.040 | 100 | 80 | 0.039 | 41 | 32 | ||||
| Total FG | 0.047 | 151 | 142 | 0.050 | 218 | 212 | 0.060 | 211 | 227 | ||||
| UHJ | 0.047 | 202 | 190 | 0.049 | 119 | 117 | 0.052 | 117 | 122 | ||||
| MHJ1 | 0.052 | 467 | 486 | 0.045 | 374 | 337 | 0.062 | 257 | 318 | ||||
| MHJ2 | 0.077 | 1,143 | 1,760 | 0.063 | 722 | 910 | 0.069 | 424 | 585 | ||||
| LHJ | 0.040 | 685 | 548 | 0.044 | 287 | 253 | 0.054 | 236 | 255 | ||||
| Total HJ | 0.064 | 2,521 | 3,021 | 0.055 | 1,503 | 1,616 | 0.063 | 1,033 | 1,280 | ||||
| UKM | 0.049 | 450 | 441 | 0.051 | 461 | 470 | 0.048 | 363 | 349 | ||||
| LKM | 0.062 | 19 | 24 | 0.043 | 169 | 145 | 0.048 | 136 | 131 | ||||
| Total KM | 0.050 | 469 | 464 | 0.049 | 630 | 616 | 0.048 | 499 | 479 | ||||
| L | ----- | ----- | ----- | ----- | ----- | ----- | ----- | ----- | ----- | ||||
| M | ----- | ----- | ----- | ----- | ----- | ----- | 0.052 | 87 | 90 | ||||
| N | ----- | ----- | ----- | ----- | ----- | ----- | 0.077 | 7 | 10 | ||||
| Total - LOST CREEK | 0.058 | 3,117 | 3,590 | 0.052 | 2,350 | 2,444 | 0.057 | 1,836 | 2,085 | ||||
| MEASURED + INDICATED = | 5,467 | 6,034 | |||||||||||
| LC EAST PROJECT | |||||||||||||
| UFG | 0.120 | 32 | 78 | 0.169 | 2 | 8 | 0.082 | 39 | 64 | ||||
| MFG | 0.061 | 13 | 15 | 0.050 | 66 | 66 | 0.052 | 38 | 39 | ||||
| LFG | 0.033 | 8 | 5 | 0.043 | 63 | 54 | 0.046 | 40 | 37 | ||||
| Total FG | 0.106 | 53 | 98 | 0.055 | 131 | 128 | 0.064 | 117 | 140 | ||||
| UHJ | 0.045 | 93 | 84 | 0.036 | 107 | 77 | 0.040 | 130 | 104 | ||||
| MHJ1 | 0.057 | 275 | 314 | 0.041 | 188 | 154 | 0.042 | 152 | 128 | ||||
| MHJ2 | 0.053 | 430 | 456 | 0.039 | 575 | 449 | 0.051 | 338 | 345 | ||||
| LHJ | 0.038 | 74 | 56 | 0.042 | 111 | 93 | 0.024 | 32 | 15 | ||||
| Total HJ | 0.053 | 873 | 910 | 0.039 | 981 | 773 | 0.046 | 651 | 592 | ||||
| UKM | 0.056 | 135 | 151 | 0.040 | 407 | 325 | 0.042 | 586 | 492 | ||||
| LKM | 0.044 | 115 | 101 | 0.040 | 144 | 115 | 0.050 | 302 | 302 | ||||
| Total KM | 0.051 | 250 | 252 | 0.040 | 551 | 441 | 0.045 | 888 | 794 | ||||
| L | ----- | ----- | ----- | 0.027 | 13 | 7 | ----- | ----- | ----- | ||||
| M | ----- | ----- | ----- | 0.046 | 13 | 12 | 0.038 | 10 | 7 | ||||
| N | ----- | ----- | ----- | ----- | ----- | ----- | ----- | ----- | ----- | ||||
| Total – LC EAST | 0.054 | 1,175 | 1,260 | 0.040 | 1,689 | 1,361 | 0.046 | 1,666 | 1,533 | ||||
| MEASURED + INDICATED = | 2,865 | 2,621 | |||||||||||
| LC NORTH PROJECT | |||||||||||||
| UFG | ----- | ----- | ----- | ----- | ----- | ----- | ----- | ----- | ----- | ||||
| MFG | ----- | ----- | ----- | ----- | ----- | ----- | ----- | ----- | ----- | ||||
| LFG | ----- | ----- | ----- | ----- | ----- | ----- | ----- | ----- | ----- | ||||
| UHJ | ----- | ----- | ----- | ----- | ----- | ----- | 0.057 | 30 | 34 | ||||
| MHJ1 | ----- | ----- | ----- | ----- | ----- | ----- | 0.069 | 34 | 47 | ||||
| MHJ2 | ----- | ----- | ----- | ----- | ----- | ----- | 0.058 | 38 | 45 | ||||
| LHJ | ----- | ----- | ----- | ----- | ----- | ----- | 0.038 | 101 | 77 | ||||
| UKM | ----- | ----- | ----- | ----- | ----- | ----- | 0.067 | 80 | 108 | ||||
| LKM | ----- | ----- | ----- | ----- | ----- | ----- | 0.042 | 52 | 44 | ||||
| L | ----- | ----- | ----- | ----- | ----- | ----- | 0.032 | 84 | 54 | ||||
| M | ----- | ----- | ----- | ----- | ----- | ----- | 0.060 | 53 | 64 | ||||
| N | ----- | ----- | ----- | ----- | ----- | ----- | 0.031 | 15 | 9 | ||||
| Total - LC NORTH | 0 | 0 | 0 | 0 | 0 | 0 | 0.049 | 489 | 482 | ||||
| 59 |
Table 10: Property Resources, by Project (Continued)
| MEASURED | INDICATED | INFERRED | |||||||||||||||
| HORIZON | AVG GRADE % eU3O8 |
SHORT TONS (X 1,000) |
POUNDS (X 1,000) |
AVG GRADE % eU3O8 |
SHORT TONS (X 1,000) |
POUNDS (X 1,000) |
AVG GRADE % eU3O8 |
SHORT TONS (X 1,000) |
POUNDS ( X 1,000) | ||||||||
| LC SOUTH PROJECT | |||||||||||||||||
| UFG | ----- | ----- | ----- | ----- | ----- | ----- | 0.052 | 91 | 95 | ||||||||
| MFG | ----- | ----- | ----- | ----- | ----- | ----- | 0.051 | 249 | 254 | ||||||||
| LFG | ----- | ----- | ----- | ----- | ----- | ----- | 0.041 | 43 | 35 | ||||||||
| UHJ | ----- | ----- | ----- | ----- | ----- | ----- | 0.033 | 36 | 24 | ||||||||
| MHJ1 | ----- | ----- | ----- | ----- | ----- | ----- | 0.033 | 52 | 35 | ||||||||
| MHJ2 | ----- | ----- | ----- | ----- | ----- | ----- | 0.037 | 96 | 71 | ||||||||
| LHJ | ----- | ----- | ----- | ----- | ----- | ----- | 0.031 | 82 | 51 | ||||||||
| UKM | ----- | ----- | ----- | ----- | ----- | ----- | 0.031 | 19 | 12 | ||||||||
| LKM | ----- | ----- | ----- | ----- | ----- | ----- | 0.032 | 42 | 27 | ||||||||
| L | ----- | ----- | ----- | ----- | ----- | ----- | ----- | ----- | ----- | ||||||||
| M | ----- | ----- | ----- | ----- | ----- | ----- | ----- | ----- | ----- | ||||||||
| N | ----- | ----- | ----- | ----- | ----- | ----- | ----- | ----- | ----- | ||||||||
| Total - LC SOUTH | 0 | 0 | 0 | 0 | 0 | 0 | 0.042 | 710 | 603 | ||||||||
| LC WEST PROJECT | |||||||||||||||||
| UFG | ----- | ----- | ----- | ----- | ----- | ----- | ----- | ----- | ----- | ||||||||
| MFG | ----- | ----- | ----- | ----- | ----- | ----- | ----- | ----- | ----- | ||||||||
| LFG | ----- | ----- | ----- | ----- | ----- | ----- | ----- | ----- | ----- | ||||||||
| UHJ | ----- | ----- | ----- | ----- | ----- | ----- | ----- | ----- | ----- | ||||||||
| MHJ1 | ----- | ----- | ----- | ----- | ----- | ----- | ----- | ----- | ----- | ||||||||
| MHJ2 | ----- | ----- | ----- | ----- | ----- | ----- | ----- | ----- | ----- | ||||||||
| LHJ | ----- | ----- | ----- | ----- | ----- | ----- | ----- | ----- | ----- | ||||||||
| UKM | ----- | ----- | ----- | ----- | ----- | ----- | 0.109 | 17 | 37 | ||||||||
| LKM | ----- | ----- | ----- | ----- | ----- | ----- | ----- | ----- | ----- | ||||||||
| L | ----- | ----- | ----- | ----- | ----- | ----- | ----- | ----- | ----- | ||||||||
| M | ----- | ----- | ----- | ----- | ----- | ----- | ----- | ----- | ----- | ||||||||
| N | ----- | ----- | ----- | ----- | ----- | ----- | ----- | ----- | ----- | ||||||||
| Total - LC WEST | 0 | 0 | 0 | 0 | 0 | 0 | 0.109 | 17 | 37 | ||||||||
| SUMMARY | |||||||||||||||||
| MEASURED | INDICATED | INFERRED | |||||||||||||||
| PROJECT | AVG GRADE |
SHORT TONS |
POUNDS | AVG GRADE |
SHORT TONS |
POUNDS | AVG GRADE |
SHORT TONS |
POUNDS | ||||||||
| % eU3O8 |
(X 1000) | (X 1000) | % eU3O8 |
(X 1000) | (X 1000) | %
eU3O8 |
(X 1000) | (X 1000) | |||||||||
| LOST CREEK | 0.058 | 3,117 | 3,590 | 0.052 | 2,350 | 2,444 | 0.057 | 1,836 | 2,085 | ||||||||
| LC EAST | 0.054 | 1,175 | 1,260 | 0.040 | 1,689 | 1,361 | 0.046 | 1,666 | 1,533 | ||||||||
| LC NORTH | ----- | ----- | ----- | ----- | ----- | ----- | 0.049 | 489 | 482 | ||||||||
| LC SOUTH | ----- | ----- | ----- | ----- | ----- | ----- | 0.042 | 710 | 603 | ||||||||
| LC WEST | ----- | ----- | ----- | ----- | ----- | ----- | 0.109 | 17 | 37 | ||||||||
| EN | ----- | ----- | ----- | ----- | ----- | ----- | ----- | ----- | ----- | ||||||||
| GRAND TOTAL | 0.057 | 4,292 | 4,850 | 0.048 | 4,039 | 3,805 | 0.051 | 4,718 | 4,740 | ||||||||
| MEASURED + INDICATED = | 8,332 | 8,655 | |||||||||||||||
Notes:
| 1. | Sum of Measured and Indicated tons and pounds may not add to the reported total due to rounding. |
| 2. | Based on grade cutoff of 0.02 percent eU3O8 and a grade x thickness cutoff of 0.3 GT. |
| 3. | Typical ISR industry practice is to apply a GT cutoff in the range of 0.3 which has generally been determined to be a cost-effective cutoff value. This 0.3 GT cutoff was used in this evaluation without direct relation to an associated price. |
| 4. | Measured, Indicated, and Inferred Mineral Resources as defined in Section 1.2 of NI 43-101 (the CIM Definition Standards (CIM Council, 2010)). | |
| 5. | Resources are reported through August 31, 2013. |
| 6. | All reported resources occur below the static water table. |
| 60 |
Table 11: Development Summary by Resource Areas
| Resource Area |
In Place Resource (lbs x 1000.) |
Recoverable Resource (lbs.x 1000) |
Project | Horizon | Injection Wells |
Production Wells |
Header Houses |
Monitor Wells |
Area Under Pattern (acre) |
Average Depth (ft.) |
| 1 (MU1) | 2,428 | 1,842 | Lost Cr | HJ | 581 | 313 | 13 | 67 | 43.9 | 450 |
| 2 (MU2) | 1,921 | 1,536 | LC East | HJ | 453 | 244 | 10 | 85 | 72.7 | 500 |
| 3 | 756 | 605 | Lost Cr | KM | 179 | 96 | 4 | 46 | 28.4 | 560 |
| 4 | 816 | 653 | Lost Cr | HJ | 194 | 104 | 4 | 61 | 27.5 | 580 |
| 5 | 706 | 564 | Lost Cr | HJ | 168 | 90 | 4 | 58 | 29.5 | 430 |
| 6 | 645 | 516 | Lost Cr | FG | 153 | 82 | 4 | 73 | 32.7 | 310 |
| 7 | 1,820 | 1,455 | LC East | HJ | 429 | 231 | 9 | 110 | 65.8 | 380 |
| 8 | 624 | 499 | LC East | KM | 147 | 79 | 3 | 80 | 27.6 | 480 |
| 9 | 415 | 332 | LC East | HJ | 99 | 53 | 2 | 64 | 22.0 | 380 |
| 10 | 395 | 316 | LC East | KM | 93 | 50 | 2 | 57 | 18.2 | 450 |
| 11 | 418 | 334 | LC East | KM | 99 | 53 | 2 | 53 | 17.7 | 350 |
| 12 | 682 | 545 | Lost Cr | KM | 164 | 88 | 4 | 41 | 13.1 | 620 |
| Total | 11,626 | 9,198 | 2,759 | 1,483 | 61 | 795 | 399 |
Sum of pounds may not add to the reported total due to rounding.
LC East Project:
Table 10 lists updated resources for the LC East Project. New resources resulted from the 2012 delineation drilling campaign consisting of 164 drill holes and re-examination using the revised estimation criteria, as discussed previously. The Project currently carries a mineral resource of 2.621 million lbs. in the Measured plus Indicated categories with an additional 1.533 million lbs. in the Inferred category. Compared to the April 30, 2012 PEA, this represents a 1.5% increase of 38 thousand lbs. to the Measured plus Indicated category, and an 88% increase of 718 thousand lbs. to the Inferred category. The new additional resources are the result mainly of wide-spaced delineation drilling testing HJ and KM trend extensions in the northwest quadrant of Section 20, and also infill drilling within previously identified trend areas.
Other Adjoining Projects:
No additional drilling activities on the LC North, LC West, LC South, and EN Projects have been conducted since the April 30, 2012 PEA. Resource estimates for these projects were reviewed by applying the updated assessment criteria as discussed above. No changes were necessary in the resources for LC West, LC South and EN. Resources for LC North were increased by 83 thousand lbs. in the Inferred category.
| 14.7 | Mineral Resource Estimate Risk |
To the extent known, the Authors are unaware of any current environmental, permitting, legal, title, taxation, socio-economic, marketing, or political factor which could materially affect the accessibility of estimated resources. Risks regarding the recovery of resources are addressed in Section 25.1.
Future potential legal risks to the accessibility of the estimated resource may include future designation of the sage grouse as an endangered species by the U.S. Fish and Wildlife Service because the Property lies within a sage grouse Core Area as defined by the state of Wyoming. This could potentially have an impact on future expansion operations, however URE continues to work closely to with the Wyoming Department of Game and Fish and the Bureau of Land Management to mitigate any impacts on sage grouse.
| 61 |
As is typical for mineral resource estimates, there is risk of improper interpretation of geological data such as grade or continuity. Improper geological data interpretation could impact the estimated resource estimate, either positively or negatively. URE has expended considerable effort to ensure the accuracy and validity of drilling and mineral data used as the foundation of the resource estimates, as discussed in Sections 7, 11 and 12. Additionally, geologists contributing to this PEA are thoroughly trained in understanding the nature of roll front uranium deposits to ensure realistic and accurate interpretations of the extent of mineralization.
| 15.0 | Mineral Reserve Estimates |
Mineral reserves were not estimated for this PEA.
| 16.0 | Mining Methods |
| 16.1 | Mineral Deposit Amenability |
URE is using the in situ recovery (ISR) technique at the Lost Creek Property. ISR is employed because this technique allows for the low cost and effective recovery of roll front mineralization. An additional benefit is that the in situ technique is relatively environmentally benign when compared to conventional open pit or underground recovery techniques. The in situ technique does not require the installation of tailings facilities or significant surface disturbance.
This mining method utilizes injection wells to introduce a mining solution, called lixiviant, into the mineralized zone. The lixiviant is made of natural groundwater fortified with oxygen as an oxidizer, sodium bicarbonate as a complexing agent, and carbon dioxide for pH control. The oxidizer converts the uranium compounds from a relatively insoluble +4 valance state to a soluble +6 valance state. The complexing agent bonds with the uranium to form uranyl carbonate which is highly soluble. The dissolved uranyl carbonate is then recovered through a series of production wells and piped to a processing plant where the uranyl carbonate is removed from the solution using Ion Exchange (IX). The groundwater is re-fortified with the oxidizer and complexing agent and sent back to the wellfield to recover additional uranium.
In order to use the in situ technique the mineralized body must be: saturated with groundwater; transmissive to water flow; and amenable to dissolution by an acceptable lixiviant. While not a requirement, it is beneficial if the production zone aquifer is relatively confined by overlying and underlying aquitards so it is easier to maintain control of the mining lixiviant. Dozens of monitor wells have been completed in the various horizons to determine the elevation of the water tables. The natural hydrostatic pressure within each horizon causes the water table to rise in the well casing to approximately 170 to 200 ft. bgs. All horizons deeper than the DE are completely saturated at the Lost Creek Project.
At the LC East Project additional baseline monitor well installations were completed in the summer of 2012. These have demonstrated that the static water table and hydrogeological conditions in the southern portions of LC East are similar to those at the Lost Creek Project and amenable to ISR extraction. However, in the northern extremes of the Project the stratigraphy shallows considerably such that mineral within the HJ Horizon is present under unconfined water table conditions which may make ISR extraction difficult. Potential mining activity in this area is focused on the KM Horizon which remains under suitable confined groundwater conditions.
| 62 |
Numerous hydrogeologic tests have been performed within the Lost Creek Project to demonstrate that the HJ Horizon is sufficiently transmissive to allow the lixiviant to flow through the production zone and dissolve the uranium mineral. The transmissivity of the HJ Horizon was measured during two separate regional pump tests in 2007 and determined to be between 30.0 and 110.0 ft.2/day (Ur-Energy Inc., 2007a). This range of transmissivities is consistent with the rates at other successful ISR operations. Production well flow rates observed to date confirm very good aquifer characteristics. The two regional tests also confirmed that the HJ Horizon behaves effectively as a confined aquifer despite minor communication with both the overlying and underlying aquifers (Ur-Energy Inc., 2007a). See Section 7.2 for additional discussion on the Property’s hydrogeology.
Several lab tests have been carried out on core samples from the Lost Creek Project to ensure leachability with an acceptable lixiviant. Test results show that recoveries of greater than 80% should be expected. See Section 13.0 for a complete discussion of leach test results.
| 16.2 | Mine Development |
URE has divided the known mineral trends of the Lost Creek Property into several Resource Areas to aid in systematic development of the resources. Resource Areas are informally designated geographic regions within the Lost Creek Property which have been defined to aid in the inventory of resources (Figure 11 and Table 11). In a general sense they are precursors to production wellfields, which may be derived from all or part of a Resource Area. A Resource Area (RA) converts to a Mine Unit (MU) when the perimeter monitor ring for the Mine Unit is defined. (Note however that the number sequence of Resources Areas may not coincide with the number sequence of proposed Mine Units.) Currently there are 12 Resource Areas (RAs) in the Lost Creek Property. RAs 1 to 6 and 12 lie within the Lost Creek Project. RAs 7 to 11 lie within the LC East Project. RA 12 represents KM mineralization underlying MU2 which was identified after the April 30, 2012 PEA. Resource Areas commonly overlap where resources in both the HJ and KM Horizons are targeted for potential production. RAs 1 and 2 have been converted to Mine Units 1 and 2 respectively. Currently, MU1 is near completion of production pattern well installation and the perimeter monitor ring has been installed in MU2. Table 11 lists the resources and projected development requirements for each Resource Area and Mine Unit. The schedule for drilling, construction, production and restoration activities for the life of mine are detailed in Figure 12.
The mine life can be described as production followed by restoration and reclamation (Figure 12). Production activities which include development, drilling, construction and production, are planned to occur from August 2013 until the fourth quarter of 2021. Restoration and reclamation activities are scheduled to start soon after production is completed in a mine unit or resource area. These are planned to occur from the first quarter 2016 through the first quarter 2025. Final decommissioning will occur simultaneous to the reclamation activities of the last resource area.
Within a production wellfield, the most fundamental component of mine development and production is the production pattern. A pattern consists of one producer well and the injection wells which feed lixiviant to it. Injection wells are commonly shared by multiple producers. Header houses serve multiple patterns and function as both distribution points for injection flow and collection points for production flow from the producer wells. The processing plant feeds injection lixiviant to the header houses for distribution to the injector wells, and also receives and processes production flow from the header houses.
| 63 |
In MU1 the first series of header houses was constructed simultaneously with the processing plant and the site infrastructure. The header houses will be brought on line sequentially until the nominal plant throughput (approximately 5,500 to 6,000 gpm) is attained. The remainder of MU1 and additional areas will be developed in such a way as to allow for plant capacity to be maintained. In other words, as the productivity or head grade from the initial header houses decreases below economic limits, replacement patterns from additional header houses will be placed into operation in order to maintain the desired flow rate and head grade at the plant.
The Lost Creek plant and the allocation of resources to Mine Units and Resource Areas are designed to generate approximately one million pounds of production per year for several years. At full flow capacity and at an average of 47 mg/L U concentration, output will equal approximately one million pounds. The production rate ramps up starting in August 2013 and ramps down in 2021 (Table 14) for a total of approximately 9.2 million pounds recovered from the Resource Areas.
| 16.3 | Piping |
Pipelines transport the wellfield solutions to and from the IX columns of the plant. The flow rates and pressures of the individual well lines are monitored in the header houses. Flow and pressure of the field production systems are also monitored and controlled as appropriate at the header houses. High density polyethylene (HDPE), PVC, stainless steel, or equivalent piping is used in the wellfields and has been designed and selected to meet design operating conditions. The lines from the plant, header houses, and individual well lines are buried for freeze protection and to minimize pipe movement.
| 16.4 | Header Houses |
Header houses are used to
distribute lixiviant injection fluid to injection wells and collect pregnant solution from production wells. Each header
house is connected to two trunk lines, one for receiving barren lixiviant from the plant and one for conveying pregnant
solutions to the plant. The header houses include manifolds, valves, flow meters, pressure gauges, instrumentation and oxygen
for incorporation into the injection lixiviant, as required. Each header house may service up to 80 wells (injection
and recovery) depending on pattern geometry.
| 16.5 | Wellfield Reagents, Electricity, Propane |
The evaluation presented in this report assumes, based on the production schedule and plan, the use of the following reagents and electricity in the wellfield on an annual basis:
| Oxygen | 59 | MM standard cubic ft | |
| Carbon dioxide | 1661 | tons | |
| Corrosion inhibitor | 13.3 | barrels | |
| Electricity | 9.4 | MM kilowatt-hours (kWh) |
| 17.0 | Recovery Methods |
The plant, which completed construction in the third quarter of 2013, consists of four major solution circuits: the uranium recovery/extraction circuit (IX); the elution circuit to remove the uranium from the IX resin; a yellowcake precipitation circuit; and the dewatering, drying and packaging circuit. Figure 13 presents a simplified, typical process flow diagram. The system recycles and reuses most of the solutions inside each circuit. A low-volume bleed is permanently removed from the water-based leaching solution flow to create a “cone of depression” in the wellfield’s static water level and ensure that the leaching solution in the target mineralized zone is contained within the designated recovery area by the inward movement of regional groundwater. This bleed solution is routed to deep disposal wells after minimizing volumes through treatment and recycling.
| 64 |
| 17.1 | Plant Processing |
The plant houses most of the process equipment in an approximate 160 ft. by 260 ft. metal building. However, hydrochloric acid, propane and soda ash are stored in silos and tanks outside of the process building. The water treatment system (reverse osmosis) used for treating the bleed and for aquifer restoration is also located in the plant. An analytical laboratory and the office are located in the same building as the plant, and a shop building is located immediately north of the plant. In addition to office space for professional staff and the on-site laboratory, the building includes the computer server room, lunchroom, and restroom/change room facilities. The shop building contains the warehouse, maintenance shop, the construction shop and the drilling shop with all the required tools/equipment and various supplies for performing maintenance and construction of wellfield systems.
Production fluid containing dissolved uranyl carbonate from the wellfields is pumped to the plant for beneficiation as described below:
IX Circuit -- Uranium liberated from the underground deposits is extracted from the solution in the IX circuit. Subsequently, the barren lixiviant is reconstituted to the proper bicarbonate strength, as needed, and pH is corrected using carbon dioxide prior to being pumped back to the wellfield for reinjection. A low-volume bleed is permanently removed from the lixiviant flow. The bleed is treated by reverse osmosis and the clean permeate is reused in the process. Brine and excess bleed is disposed of by means of injection into Underground Injection Control (UIC) Class I deep disposal wells (DDW).
Elution Circuit -- When it is fully loaded with uranyl carbonate, the IX resin is subjected to elution. The elution process reverses the loading reactions for the IX resin and strips the uranium from the resin. The resulting rich eluate is an aqueous solution containing uranyl carbonate, salt and sodium carbonate and/or sodium bicarbonate.
Yellowcake Precipitation Circuit -- Yellowcake is produced from the rich eluate. The eluate from the elution circuit is de-carbonated in tanks by lowering the pH to approximately two standard units with hydrochloric acid. The uranium is precipitated with hydrogen peroxide using sodium hydroxide for pH control.
Yellowcake Dewatering, Drying and Packaging Circuit -- The precipitated yellowcake slurry is transferred to a filter press where excess liquid is removed. Following a fresh water wash step that flushes any remaining dissolved chlorides, the resulting product cake is transferred to a yellowcake dryer which will further reduce the moisture content, yielding the final dried free-flowing product. Refined yellowcake is packaged in 55-gallon steel drums.
For the purposes of this Preliminary Economic Assessment, it has been assumed that all drummed yellowcake will be shipped via truck approximately 1,200 miles to the conversion facility in Metropolis, Illinois. This conversion facility is the first manufacturing step in converting the yellowcake into reactor fuel.
| 65 |
| 17.2 | Energy, Water and Process Materials |
Estimates used in the evaluation presented in this report assume the annual consumption of approximately 47,400 gallons of propane and 9.1 MM kWh of electricity to heat and light the plant and operate the process equipment.
The consumptive use of groundwater at the Property is related to plant processes and maintenance of a hydrologic cone of depression (bleed) in the operating wellfields. At full operating capacity, the processing plant utilizes approximately 10 gpm of water. In addition, the hydrologic bleed requirement for the wellfields are 0.5% to 1.5% of the production flowrate. Therefore, the wellfields generate up to 60 gpm of waste water at full operating capacity. Also, up to 50 gpm of waste water may be generated periodically from restoration associated activities such as groundwater sweep and/or reverse osmosis.
Chemicals that are anticipated to be used in the plant processes and the assumed annual consumption rates include:
| Hydrochloric acid | 2.45 | MM lbs./year | |
| Caustic soda | 1.02 | MM lbs./year | |
| Peroxide | 0.35 | MM lbs./year | |
| Salt | 1.56 | MM lbs./year | |
| Soda ash or bicarbonate | 1.97 | MM lbs./year | |
| Resin (make-up/replacement) | 100 | cubic ft./year |
The different types of chemicals are stored, used and managed so as to ensure worker and environmental safety in accordance with standards developed by regulatory agencies and vendors. The hydrochloric acid and hydrogen peroxide, salt and sodium hydroxide storage areas include secondary containment. Sodium hydroxide and the various acid and caustic chemicals are of potential concern and are stored and handled with care. To prevent unintentional releases of hazardous chemicals and limit potential impacts to workers, the public and the environment, URE is implementing and maintaining internal operating procedures consistent with federal, state and local requirements.
| 17.3 | Liquid Disposal |
Typical ISR mining operations require a disposal well for limited quantities of fluids that cannot be returned to the production aquifers. Five UIC DDWs are permitted at Lost Creek of which two have been drilled and cased, tested and surface injection equipment installed. The CAPEX and OPEX estimates for this Preliminary Economic Assessment assume that these two wells will support the production and restoration operations given an upgraded reverse osmosis system and use of permeate for clean water uses at the facility. The maximum volume of liquid wastes at the plant will be approximately 70 gpm during normal operations and up to 115 gpm during restoration.
| 17.4 | Solid Waste Disposal |
Solid wastes consist of spent resin, empty packaging, miscellaneous pipes and fittings, tank sediments, used personal protective equipment and domestic trash. These materials are classified as contaminated or non-contaminated based on their radiological characteristics.
| 66 |
Non-contaminated solid waste is waste which is not contaminated with radioactive material or which can be decontaminated and re-classified as non-contaminated waste. This type of waste may include trash, piping, valves, instrumentation, equipment and any other items which are not contaminated or which may be successfully decontaminated. Current estimates are that the site will produce approximately 700 cubic yards of non-contaminated solid waste per year. Non-contaminated solid waste is collected in designated areas at the Project site and disposed of in the nearest permitted sanitary landfill.
Contaminated solid waste consists of solid waste contaminated with radioactive material that cannot be decontaminated. This waste will be classified as 11e.(2) by-product material as defined by NRC regulations. This by-product material consists of filters, personal protective equipment, spent resin, piping, etc. These materials are temporarily stored on-site and periodically transported for disposal. URE has established an agreement for disposal of this waste as 11e.(2) by-product material at a licensed waste disposal site which is a licensed mill tailings facility. It is estimated that the site will produce approximately 90 cubic yards of 11e.(2) by-product material as waste per year. This estimate is based on the waste generation rates of similar in situ uranium recovery facilities.
| 18.0 | Project Infrastructure |
The infrastructure for the Lost Creek wellfield and plant are described in Sections 16.0 and 17.0 above. All necessary components for the plant and the first wellfield have been constructed and are in use.
| 18.1 | Roads |
There are four types of roads being used for access to the Project. They include primary access roads, secondary access roads, temporary wellfield access roads, and well access roads. Access to the Project is from the west via Wamsutter-Crooks Gap Road or from the east via BLM Sooner Road (Figure 2).
Primary access roads are used for routine access to the main processing facility at the Project. URE has constructed approximately 50,000 ft. of new road to serve as Project access.
The main access roads average 20 ft. wide and are surfaced with gravel. Snow removal and periodic surface maintenance will be performed as needed. The secondary access roads are used at the Project to provide access to the wellfield header houses. The secondary access roads are constructed with limited cut and fill construction and may be surfaced with small sized aggregate or other appropriate material.
The temporary wellfield access roads are for access to drilling sites, wellfield development, or ancillary areas assisting in wellfield development. When possible, URE will use existing two-track trails or designate two-track trails where the land surface is not typically modified to accommodate the road. The temporary wellfield access roads will be used throughout the mining areas and will be reclaimed at the end of mining.
| 18.2 | Laboratory Equipment |
Laboratory equipment consists of inductively coupled plasma (ICP) emission spectrometers for analyses of uranium and metals, an auto-titrator for alkalinity and chloride measurements, specific conductance meter and other equipment, materials and supplies required to efficiently operate the mine and plant. In addition, the laboratory has fume hoods, reagent storage cabinets and other safety equipment.
| 67 |
| 18.3 | Electricity |
A pre-existing 34,500 volt power line owned by Pacific Power Corp. extends north-south along the western edge of the Lost Creek Project. The line was originally installed to serve the Sweetwater Mill which is south of the Property. Pacific Power Corp. performed a power study and determined that the line has capacity to serve the Lost Creek Project without any upgrades. A new overhead raptor resistant power line, approximately 2 miles in length, was constructed to bring power from the existing Pacific Power line to the Lost Creek plant. Line drops have been made to the existing header houses, plant, and other buildings where the power is transformed to three phase 480 volts. Power lines from header houses to production wells are placed underground using direct burial wire.
| 18.4 | Holding Ponds |
Two holding ponds have been installed for the facility and are currently in use. The holding ponds, which are located immediately east of the plant, are used to contain process waste water when the DDWs are shut down for maintenance and annual testing. The earthen banked ponds each are approximately 155 by 260 ft. as measured from crest to crest. The ponds have a double lined containment system with leak detection between the liners. Rigorous procedures have been established to ensure proper inspection, operation, and maintenance of the holding ponds.
| 19.0 | Market Studies and Contracts |
Unlike other commodities, uranium does not trade on an open market. Contracts are negotiated privately by buyers and sellers. Economic analysis to date assumes a variable price per pound for U3O8 over the life of the Project ranging from $39.25 to $72.50 per pound. This price is based on a combination of forecasts from RBC Capital Markets, Dundee Capital Markets, J.P. Morgan Securities, Raymond James Ltd. and the actual commitments URE has in place. As this price forecast was published and incorporated into these calculations immediately prior to the writing of this document, Mr. Graves believes that the estimates remain appropriate for use in this evaluation.
The marketability of uranium and acceptance of uranium mining is subject to numerous factors beyond the control of URE. The price of uranium may experience volatile and significant price movements over short periods of time. Factors known to affect the market and the price of uranium include demand for nuclear power; political and economic conditions in uranium mining, producing and consuming countries; costs; interest rates, inflation and currency exchange fluctuations; governmental regulations; availability of financing of nuclear plants, reprocessing of spent fuel and the re-enrichment of depleted uranium tails or waste; sales of excess civilian and military inventories (including from the dismantling of nuclear weapons) by governments and industry participants; production levels and costs of production in certain geographical areas such as Russia, Africa and Australia; and changes in public acceptance of nuclear power generation as a result of any future accidents or terrorism at nuclear facilities. The 2011 Fukushima incident is an example of this. However, it is unclear as to the long-term effects on the term price market for uranium. The economic analysis and associated sensitivities are within the range of current market variability.
URE has completed six uranium supply arrangements at defined pricing within industry norms. The agreements relate to a portion of anticipated production during the defined term and, together with their defined pricing, are considered within the sensitivities in this report (Figure 14). The income from the contracted portion of production, along with the other estimated production at the anticipated sales price, is included in the cash flow estimate.
| 68 |
During the construction phase of the plant, several contracts were held with various contractors. These have all been completed. Operational purchasing agreements exist with the primary chemical suppliers. The chemicals for which these exist are in Sections 16.5 and 17.2. The terms of these agreements vary between 1 and 5 years in length. Finally, contracts or agreements are in place with RSB Logistics Inc. for transporting yellowcake from the Lost Creek Property; ConverDyn for processing of yellowcake concentrates; and Pathfinder Mines for disposal of 11e.(2) byproduct material waste.
| 20.0 | Environmental Studies, Permitting, Social or Community Impact |
Exhaustive environmental studies have been performed in support of the Permit to Mine Application submitted to the WDEQ, the License Application submitted to the NRC, and the BLM Plan of Operations. These studies include: geology, surface hydrology, sub-surface hydrology, geochemistry, wetlands, air quality, vegetation, wildlife, archeology, meteorology, background radiometrics, and soils (Ur-Energy Inc., 2007a and Ur-Energy Inc., 2007b). Upon receipt of the applications, the WDEQ and NRC spent several years reviewing the environmental studies with internal and third party experts and ultimately concluded that the mining activity as proposed was protective of the environment. After their technical reviews, including numerous opportunities for public comment, and as indicated in Section 4, all necessary permits and licenses to operate the mine have been issued.
| 20.1 | Environmental Studies and Issues |
The license and mine permit applications were developed to define and evaluate the potential for impacts to other environmental resources and were submitted to and approved by the NRC, WDEQ and BLM. Evaluation subjects included: existing and anticipated land use, transportation, geology, soils, seismic risk, water resources, climate/meteorology, vegetation, wetlands, wildlife, air quality, noise, and historic and cultural resources. Additionally, socioeconomic characteristics in the vicinity of the Project were evaluated. In these evaluations, no impacts from Project development were identified that could not be mitigated (Ur-Energy Inc., 2007a, 2007b). The NRC and WDEQ issued final approvals for the Lost Creek Project in 2011. The BLM issued its Record of Decision for approval of the Environmental Impact Statement in October 2012.
Discussion of the results of site-specific environmental studies is given below.
Background Radiological Characteristics
Background radiological characteristics for the Lost Creek Project were evaluated in 2006 and 2007 to establish radiological baseline conditions and document the pre-operational radiological environment. The evaluations were performed for surface soils, subsurface soils, sediment and flora. In addition, a baseline gamma survey was performed, and Radon-222 and direct gamma exposure rates were measured.
The results of the study are presented in detail in the “Ur-Energy Inc., Lost Creek ISR Project, Wyoming DEQ Permit to Mine Application” (Ur-Energy Inc., 2007a) and the “Ur-Energy Inc., Lost Creek, NRC Source Material License Application, 2007” (Ur-Energy Inc., 2007b). In general, the baseline study indicates that most site radiological properties are in normal ranges.
| 69 |
Additional baseline radiological studies are on-going within the LC East Project in preparation of an application for an amendment to the permits and license to include production from the EMT.
Threatened, Endangered, or Candidate Species
As defined by WDEQ-Land Quality Division (LQD) Guideline No. 2, a literature review was conducted to identify species of special concern, prohibited and restricted noxious weeds, and selenium indicators that could be present within the Permit Area. The review identified several species that occur within the general region.
Threatened and endangered species of the region include the blowout penstemon (Penstemon haydenii) and the desert yellowhead (Yermo xanthocephalus). Descriptions of these species are provided below.
| · | Blowout penstemon: This is the only endangered plant species in Wyoming and is known from an area south of the Ferris Mountains, in northwestern Carbon County (Fertig, 2000). While the species is known to occur on a site approximately 32 miles east-northeast of the Permit Area, it is unlikely to occur in the Permit Area. Blowout penstemon grows exclusively in sand blowout areas, a habitat type absent in the Permit Area. The site south of the Ferris Mountains is the only known location for the species in Wyoming. The only other known populations of blowout penstemon occur in similar sand blowout habitats in northwestern Nebraska. |
| · | Desert yellowhead: This is a threatened species in Wyoming, occurring in southern Fremont County in the Beaver Rim Area, approximately 45 miles northwest of the Permit Area. This species was first discovered in 1990; the only known population occurs in the Beaver Rim Area. The species appears to be restricted to surface outcrops of Miocene ash deposits. The known populations occur in an area of approximately 42 acres; however, plants occur on only approximately eight acres within the overall distribution area. Studies conducted subsequent to the 1990 discovery have not identified any other localities of the species (Heidel, 2002). |
An additional 12 rare plant species are known to occur in Sweetwater County. During the vegetation surveys, special consideration was given to these species of special concern and micro-environments capable of supporting these species. However, no species of special concern were observed within the Permit Area.
While not currently listed as a threatened or endangered species, the Greater Sage Grouse, which is indigenous to the area, is under review by the U.S. Fish and Wildlife Service and may eventually be listed as a threatened or endangered species.
Cultural and Historic Resources
By request of the BLM, the historic and cultural resources are not publicly disclosed.
Visual and Scenic Resources
During construction and operations, visual resources will be impacted to some degree by vegetative disturbance, road building, drilling, piping, and facility construction. A maximum of approximately 165 acres of vegetation will be disturbed at any one time. This estimate includes all on-site roads, operating mine units, mud pits for resource and delineation and monitor wells, and pipelines. The total footprint of the Plant will be ten acres, and the maximum height of any building is 45 feet. Mine unit development will occur sequentially, with reclamation in the first mine unit concurrent with construction and operations in later mine units. No more than four percent of the Permit Area should be disturbed at any time.
| 70 |
Most of these modifications will not be visible from the public road network, which is lightly traveled. The Plant is located 4.5 miles from the nearest county road, and the rolling topography will hide the facilities from travelers, except from a limited number of vantage points. There are no locally important or high-quality views that are affected by the Project. Project facilities are discernable, but are not a dominant landscape feature to observers outside the Permit Area.
Impacts are temporary, since buildings and roads will be decommissioned and removed at the Project’s end and vegetation will be restored to its previous condition. ISR operations cause no modifications to scenery or topography that will persist after restoration and reclamation.
20.2 Byproduct Disposal
11e.(2) or non-11e.(2) byproduct disposal methods are discussed in detail in Section 17. Deep disposal wells, landfills, and licensed 11e.(2) facilities will be used depending on the level of contamination for the given waste product.
20.3 Permitting Requirements, Permit Status, Financial Assurance
Permitting requirements, status and financial assurance are discussed in Section 4.6 and 4.7. In summary, all necessary permits and licenses to operate the mine have been issued.
Financial surety is required by the State of Wyoming and the NRC. The Project is currently secured for the entire estimated amount of closure costs for in-place equipment and will be secured for the entire estimated amount of total closure costs over the life of the Project. This includes groundwater restoration, facility decommissioning and reclamation. Surety details are discussed in Section 4.6.
20.4 Community Affairs
The project is proximate to the communities of Bairoil, Jeffrey City, Wamsutter, Riverton, Lander and Rawlins, Wyoming. URE has hired its personnel from most of these communities as well as from Casper, Wyoming. Employment has had a positive impact to these communities not only through direct payroll, but through primary and secondary purchases of goods and services.
URE maintains routine contacts with landowners, local communities and businesses, and the general public through direct calls and attending various local meetings. The senior operational managers and environmental manager are onsite at the facility, and are included in the administrative support labor costs in operating costs.
The NRC, WDEQ and BLM evaluated socioeconomic characteristics in the vicinity of the Project. No impacts from Project development were identified that could not be mitigated (Ur-Energy, 2007a, 2007b). The NRC and WDEQ issued final approvals for the Lost Creek Project in 2011. The BLM issued its Record of Decision for approval of the Environmental Impact Statement in October 2012.
20.5 Project Closure
Well Abandonment / Groundwater Restoration
Groundwater restoration will begin as soon as practicable after uranium recovery in each wellfield is completed (as determined by project economics). If a depleted wellfield is near an area that is being recovered, a portion of the depleted area’s restoration may be delayed to limit interference with the on-going recovery operations.
| 71 |
Restoration completion assumes up to six pore volumes of groundwater will be extracted and treated by reverse osmosis. Following completion of successful restoration activities, the injection and recovery wells will be plugged and abandoned in accordance with WDEQ/LQD regulations. Monitor wells will also be abandoned following verification of successful groundwater restoration.
Demolition and Removal of Infrastructure
Simultaneous with well abandonment operations, the trunk and feeder pipelines will be removed, tested for radiological contamination, segregated as either solid 11e.(2) or non-11e.(2) then chipped and transported to appropriate disposal facilities. The header houses will be disconnected from their foundations, decontaminated, segregated as either solid 11e.(2) or non-11e.(2), and transported to appropriate disposal facilities or recycled. The processing equipment and ancillary structures will be demolished, tested for radiological properties, segregated and either scrapped or disposed of in appropriate disposal facilities based on their radiological properties.
Site Grading and Revegetation
Following the removal of wellfield and plant infrastructure, site roads will be removed and the site will be re-graded to approximate pre-development contours and the stockpiled topsoil placed over disturbed areas. The disturbed areas will then be seeded.
| 21.0 | Capital and Operating Costs |
Capital Costs (CAPEX) and Operating Costs (OPEX) are based on actual and estimated costs for the Lost Creek Property. This analysis is based on the Measured and Indicated plus Inferred mineral resources in the Lost Creek and LC East Projects as described in Section 14.0. The majority of the CAPEX costs, including the installation of the processing plant, disposal wells and a portion of the drilling and installation of Mine Unit 1, were incurred prior to the completion of this economic analysis. OPEX costs include the remaining drilling and installation of the Mine Units as well as all operating costs such as chemicals, labor, utilities and maintenance. OPEX costs are most sensitive to wellfield costs – which may increase if well spacing needs to be reduced or additional injection/recovery wells are required. In addition, a shortage of drilling rigs and the increasing costs of well and piping materials (PVC, HDPE) may also lead to increased OPEX costs.
| 21.1 | Capital Cost Estimation (CAPEX) |
The majority of the CAPEX occurred prior to this economic analysis, herein referred to as initial capital. Subsequent Mine Unit drilling and installation costs are considered in the OPEX category after the start of production. The only remaining items in the CAPEX category for the remainder of the mine life are in the sustaining capital category.
Table 2, in Section 1.0, provides a summary of initial capital costs for the plant and wellfields. Total initial capital costs of plant and wellfields total $46.5 million including initial wellfield costs of $12.3 million.
Remaining CAPEX costs are for sustaining capital requirements at the mine-site and are primarily associated with replacement equipment used in future operations of the plant and the wellfield. The sustaining capital cost is estimated to be $1.7 million. The sustaining capital estimate is based on the actual previous purchases of the same equipment and/or vendor prices, thus the sustaining capital estimate contains contingency of 10% and is considered to have a predicted level of accuracy of the sustaining capital estimate is +/- 10%.
| 72 |
| 21.2 | Operating Cost Estimation (OPEX) |
The OPEX costs have been developed by evaluating each process unit operation and the associated required services (power, water, air, waste disposal), infrastructure (offices, change rooms shop), salary and burden, and environmental control (heat, air conditioning, monitoring). In addition, OPEX costs also include the remaining construction of the mine unit surface facilities and wells to mine the MMT and the EMT. The Annual OPEX and the Closure Cost Summary for the plant are provided in Table 12. Total OPEX costs, including selling, production and operating costs, have been estimated at $106.2 million, or approximately $11.54 per pound. The predicted level of accuracy of the OPEX and Closure estimates is approximately +/- 20%. The prices for the major items identified in this report have been sourced in the United States. Major cost categories considered when developing OPEX costs include wellfield, plant and site administration costs as detailed in Table 12.
Wellfield Development Costs
As discussed in Section 16, the first series of header houses in MU1 were constructed simultaneously with the processing plant and the site infrastructure. The header houses will be brought on line sequentially until the nominal plant throughput (approximately 5,500 to 6,000 gpm) is attained. The remainder of MU1 and additional areas will be developed in such a way as to allow for plant capacity to be maintained.
The wellfield development costs include both wellfield drilling and wellfield construction activities and were estimated based on preliminary wellfield designs including the number, location, depth and construction material specifications for wells and header houses and the hydraulic conveyance (piping) system associated with the wellfields. Additionally, trunk and feeder pipelines, electrical service, roads and wellfield fencing are included in the cost estimates. The wellfield development estimate is based on actual costs from vendors, contractors, labor wages and equipment rates used to drill and construct the initial portion of MU1 and includes a 10% contingency. The estimated wellfield development cost for the remainder of the Project is $73.2 million or $7.96 per pound and is illustrated annually in Table 13.
| 22.0 | Economic Analysis |
Cautionary statement: this Preliminary Economic Assessment is preliminary in nature, and includes inferred mineral resources that are considered too speculative geologically to have the economic considerations applied to them that would enable them to be categorized as mineral reserves. The estimated mineral recovery used in this Preliminary Economic Assessment is based on site-specific laboratory recovery data as well as URE personnel and industry experience at similar facilities. There can be no assurance that recovery at this level will be achieved.
22.1 Assumptions
The economic assessment presented in this Preliminary Economic Assessment is based on an 80% recovery of the following total resources defined within the MMT and the EMT trends:
| Measured: | 4.728 million lbs. at an avg. grade of 0.066% in 3.960 million tons | |
| Indicated: | 3.516 million lbs. at an avg. grade of 0.049% in 3.595 million tons | |
| Inferred: | 3.381 million lbs. at an avg. grade of 0.048% in 3.508 million tons |
| 73 |
Table 12: Annual Operating Costs (OPEX) Summary
| Life of Mine Operating Costs | 2013 | 2014 | 2015 | 2016 | 2017 | 2018 | 2019 | 2020 | 2021 | 2022 | 2023 | 2024 | 2025 | 2026 | Total | $/lb | ||||||||||||||||
| Salaries and Wages (Plant) | $ | (443.0) | $ | (1,717.4) | $ | (1,662.6) | $ | (1,662.6) | $ | (1,662.6) | $ | (1,662.6) | $ | (1,662.6) | $ | (1,662.6) | $ | (1,662.6) | $ | (1,332.0) | $ | (941.9) | $ | (787.0) | $ | (126.0) | $ | - | $ | (16,985.6) | $ | (1.85) |
| Salaries and Wages (Wellfield) | $ | (575.3) | $ | (2,301.3) | $ | (2,301.3) | $ | (2,301.3) | $ | (2,301.3) | $ | (2,301.3) | $ | (2,301.3) | $ | (2,177.0) | $ | (1,078.7) | $ | (460.6) | $ | (153.6) | $ | (344.7) | $ | (64.9) | $ | - | $ | (18,662.5) | $ | (2.03) |
| Wellfield costs (excludes closure related) | $ | (258.4) | $ | (1,356.6) | $ | (1,421.6) | $ | (1,435.8) | $ | (1,431.3) | $ | (1,386.0) | $ | (1,448.5) | $ | (1,434.9) | $ | (1,124.6) | $ | (363.2) | $ | - | $ | - | $ | - | $ | - | $ | (11,660.9) | $ | (1.27) |
| Processing Plant Costs (excludes closure related) | $ | (614.6) | $ | (2,476.4) | $ | (2,614.1) | $ | (2,573.4) | $ | (2,540.1) | $ | (2,461.6) | $ | (2,573.3) | $ | (2,616.2) | $ | (1,462.0) | $ | (288.6) | $ | (288.6) | $ | (288.6) | $ | (48.1) | $ | - | $ | (20,845.6) | $ | (2.27) |
| Product Shipping Costs & Conversion Facility Fees | $ | (58.0) | $ | (373.1) | $ | (396.8) | $ | (381.2) | $ | (399.3) | $ | (380.6) | $ | (401.8) | $ | (396.8) | $ | (212.7) | $ | (16.1) | $ | - | $ | - | $ | - | $ | - | $ | (3,016.2) | $ | (0.33) |
| BLM & State Land Holding & Surface Impact Costs | $ | (71.6) | $ | (71.6) | $ | (71.6) | $ | (71.6) | $ | (71.6) | $ | (71.6) | $ | (71.6) | $ | (71.6) | $ | (71.6) | $ | (71.6) | $ | (71.6) | $ | (71.6) | $ | (71.6) | $ | (71.6) | $ | (1,002.8) | $ | (0.11) |
| NRC Fees | $ | (259.5) | $ | (494.3) | $ | (125.3) | $ | (156.3) | $ | (156.3) | $ | (94.3) | $ | (156.3) | $ | (218.3) | $ | (94.3) | $ | (94.3) | $ | (94.3) | $ | (94.3) | $ | (94.3) | $ | (81.8) | $ | (2,214.2) | $ | (0.24) |
| Insurance & Bonding | $ | (5,311.7) | $ | (3,665.9) | $ | (837.3) | $ | (1,848.2) | $ | (625.0) | $ | 200.0 | $ | 250.0 | $ | 300.0 | $ | 350.0 | $ | 1,225.0 | $ | 1,325.0 | $ | 1,837.5 | $ | 1,550.0 | $ | - | $ | (5,250.5) | $ | (0.57) |
| Subtotal | $ | (7,592.2) | $ | (12,456.6) | $ | (9,430.6) | $ | (10,430.4) | $ | (9,187.5) | $ | (8,158.0) | $ | (8,365.4) | $ | (8,277.4) | $ | (5,356.5) | $ | (1,401.5) | $ | (225.1) | $ | 251.2 | $ | 1,145.0 | $ | (153.5) | $ | (79,638.4) | $ | (8.66) |
| Closure costs (less wages) | $ | - | $ | - | $ | (7.6) | $ | (530.4) | $ | (651.2) | $ | (624.5) | $ | (1,215.6) | $ | (1,077.3) | $ | (1,345.3) | $ | (729.2) | $ | (740.8) | $ | (11,004.5) | $ | (2,073.6) | $ | - | $ | (20,000.0) | $ | (2.17) |
| Home Office Support and Allocated Overhead | $ | (165.0) | $ | (500.0) | $ | (500.0) | $ | (500.0) | $ | (500.0) | $ | (500.0) | $ | (500.0) | $ | (500.0) | $ | (500.0) | $ | (500.0) | $ | (500.0) | $ | (500.0) | $ | (500.0) | $ | (375.0) | $ | (6,540.0) | $ | (0.71) |
| Subtotal | $ | (165.0) | $ | (500.0) | $ | (507.6) | $ | (1,030.4) | $ | (1,151.2) | $ | (1,124.5) | $ | (1,715.6) | $ | (1,577.3) | $ | (1,845.3) | $ | (1,229.2) | $ | (1,240.8) | $ | (11,504.5) | $ | (2,573.6) | $ | (375.0) | $ | (26,540.0) | $ | (2.89) |
| Total | $ | (7,757.2) | $ | (12,956.6) | $ | (9,938.2) | $ | (11,460.8) | $ | (10,338.6) | $ | (9,282.5) | $ | (10,081.0) | $ | (9,854.7) | $ | (7,201.8) | $ | (2,630.7) | $ | (1,465.9) | $ | (11,253.3) | $ | (1,428.6) | $ | (528.5) | $ | (106,178.4) | $ | (11.54) |
| 1. | Wellfield operating costs include power, maintenance, chemicals and other wellfield operating costs (Wellfield Development costs are shown separately in Table 13). |
| 2. | Closure costs assume no salvage value for materials and equipment. |
| 3. | BLM land holding cost assumes an annual assessment of $150 on each claim (469 total). State fees include $1,280 annual lease plus surface impact of $2/acre. |
| 4. | NRC annual fees include $8,320 for Annual Inspections, $50,000 for NRC Project Manager, $100,000 for RO modification review, $36,000 for License fees, $31,000 for each Mine Unit review and $300,000 for the KM/LCE Amendment. |
| 5. | Shipping costs are based on 38,400 # yellowcake shipments to Metropolis, Illinois. |
| 6. | Bonding requires a 2.5% premium to be paid and 40% collateral to be posted. The posted collateral is returned as closure work is completed and the bonding requirement is reduced. |
| 7. | Closure costs are based on WDEQ approved unit costs from October 2013 and detailed engineering work. |
| 74 |
Table 13: Cash Flow Statement ($US 000s)
| Description | 2013 | 2014 | 2015 | 2016 | 2017 | 2018 | 2019 | 2020 | 2021 | 2022 | 2023 | 2024 | 2025 | 2026 | Total | $/lb | ||||||||||||||||
| Pounds produced | 332,606 | 1,144,095 | 1,224,207 | 1,200,521 | 1,181,122 | 1,135,485 | 1,200,464 | 1,225,435 | 553,890 | - | - | - | - | - | 9,197,825 | |||||||||||||||||
| Pounds sold | 100,000 | 1,200,000 | 1,200,000 | 1,200,000 | 1,200,000 | 1,100,000 | 1,200,000 | 1,200,000 | 700,000 | 97,825 | - | - | - | - | 9,197,825 | |||||||||||||||||
| Sales | $ | 6,579.5 | $ | 64,918.0 | $ | 74,320.5 | $ | 83,851.3 | $ | 80,976.5 | $ | 69,943.7 | $ | 77,198.5 | $ | 78,000.0 | $ | 45,500.0 | $ | 6,358.6 | $ | - | $ | - | $ | - | $ | - | $ | 587,646.6 | $ | 63.89 |
| Royalties | $ | - | $ | - | $ | - | $ | (326.2) | $ | (120.1) | $ | - | $ | - | $ | - | $ | - | $ | - | $ | - | $ | - | $ | - | $ | - | $ | (446.3) | $ | (0.05) |
| Wyoming severance tax | $ | (480.4) | $ | (1,404.1) | $ | (1,708.9) | $ | (1,849.8) | $ | (1,764.4) | $ | (1,614.7) | $ | (1,720.1) | $ | (1,779.9) | $ | (752.2) | $ | (47.6) | $ | - | $ | - | $ | - | $ | - | $ | (13,122.1) | $ | (1.43) |
| Sweetwater ad valorem tax | $ | (767.2) | $ | (2,242.4) | $ | (2,729.1) | $ | (2,954.1) | $ | (2,817.7) | $ | (2,578.6) | $ | (2,747.0) | $ | (2,842.6) | $ | (1,201.3) | $ | (76.0) | $ | - | $ | - | $ | - | $ | - | $ | (20,956.0) | $ | (2.28) |
| Net sales | $ | 5,331.8 | $ | 61,271.4 | $ | 69,882.5 | $ | 78,721.1 | $ | 76,274.4 | $ | 65,750.4 | $ | 72,731.4 | $ | 73,377.5 | $ | 43,546.5 | $ | 6,235.1 | $ | - | $ | - | $ | - | $ | - | $ | 553,122.1 | $ | 60.14 |
| Operating costs (see Table 12) | $ | (7,757.2) | $ | (12,956.6) | $ | (9,938.2) | $ | (11,460.8) | $ | (10,338.6) | $ | (9,282.5) | $ | (10,081.0) | $ | (9,854.7) | $ | (7,201.8) | $ | (2,630.7) | $ | (1,465.9) | $ | (11,253.3) | $ | (1,428.6) | $ | (528.5) | $ | (106,178.4) | $ | (11.54) |
| Wellfield Development | $ | (927.9) | $ | (9,953.2) | $ | (14,820.7) | $ | (7,471.4) | $ | (13,193.2) | $ | (8,303.0) | $ | (12,322.2) | $ | (6,181.6) | $ | - | $ | - | $ | - | $ | - | $ | - | $ | - | $ | (73,173.1) | $ | (7.96) |
| Exploration cost | $ | - | $ | - | $ | - | $ | - | $ | - | $ | (1,500.0) | $ | (1,500.0) | $ | - | $ | - | $ | - | $ | - | $ | - | $ | - | $ | - | $ | (3,000.0) | $ | (0.33) |
| Sweetwater property tax | $ | - | $ | (441.7) | $ | (387.5) | $ | (327.2) | $ | (266.8) | $ | (209.1) | $ | (152.5) | $ | (91.1) | $ | (29.0) | $ | 0.0 | $ | 0.0 | $ | 0.0 | $ | 0.0 | $ | 0.0 | $ | (1,905.0) | $ | (0.21) |
| Working capital changes | $ | (5,331.8) | $ | (4,520.2) | $ | (1,840.0) | $ | (154.6) | $ | 5,248.8 | $ | 572.7 | $ | (59.2) | $ | 32.5 | $ | 6,051.9 | $ | - | $ | - | $ | - | $ | - | $ | - | $ | - | $ | - |
| Project cash flow | $ | (8,685.1) | $ | 33,399.8 | $ | 42,896.2 | $ | 59,307.0 | $ | 57,724.5 | $ | 47,028.5 | $ | 48,616.5 | $ | 57,282.5 | $ | 42,367.5 | $ | 3,604.4 | $ | (1,465.9) | $ | (11,253.3) | $ | (1,428.6) | $ | (528.5) | $ | 368,865.6 | $ | 40.10 |
| Initial capital | $ | (46,476.2) | $ | - | $ | - | $ | - | $ | - | $ | - | $ | - | $ | - | $ | - | $ | - | $ | - | $ | - | $ | - | $ | - | $ | (46,476.2) | $ | (5.05) |
| Commissioning capital | $ | (975.1) | $ | - | $ | - | $ | - | $ | - | $ | - | $ | - | $ | - | $ | - | $ | - | $ | - | $ | - | $ | - | $ | - | $ | (975.1) | $ | (0.11) |
| Sustaining capital | $ | (420.2) | $ | (426.0) | $ | (171.9) | $ | (14.6) | $ | (318.2) | $ | (173.6) | $ | (10.8) | $ | (186.8) | $ | - | $ | - | $ | - | $ | - | $ | - | $ | - | $ | (1,722.2) | $ | (0.19) |
| Net cash flow | $ | (56,556.6) | $ | 32,973.8 | $ | 42,724.2 | $ | 59,292.4 | $ | 57,406.3 | $ | 46,854.9 | $ | 48,605.7 | $ | 57,095.8 | $ | 42,367.5 | $ | 3,604.4 | $ | (1,465.9) | $ | (11,253.3) | $ | (1,428.6) | $ | (528.5) | $ | 319,692.1 | $ | 34.76 |
| 1. | Production is based on an 80% recovery of the total of Measured, Indicated and Inferred resources per NI 43-101 Section 2.3(3). |
| 2. | Uranium price is a combination of the projections of RBC Capital Markets, Dundee Capital Markets, J.P. Morgan Securities, Raymond James Ltd. and the actual commitments URE has in place. |
| 3. | All amounts in US $ 000s. |
| 4. | Wellfield Development includes wellfield drilling and wellfield construction costs. |
| 5. | Working capital changes are primarily related to annual cash flow timing differences in accounts receivable and accounts payable and totals to zero. |
| 6. | Income tax is not included in the Cash Flow Statement. |
| 7. | The NPV and IRR calculations are based on Year 2013 to Year 2026. |
IRR = 74.5%
Net Present Value versus Discount Rate
| Discount Rate | NPV ($US 000s) |
| 5% | $236,238 |
| 8% | $198,265 |
| 10% | $176,809 |
| 75 |
| Measured: | 4.728 million lbs. at an avg. grade of 0.066% in 3.960 million tons | |
| Indicated: | 3.516 million lbs. at an avg. grade of 0.049% in 3.595 million tons | |
| Inferred: | 3.381 million lbs. at an avg. grade of 0.048% in 3.508 million tons |
A cash flow statement has been developed based on the CAPEX, OPEX and closure cost estimates and the production schedule. The sale price for the produced uranium is assumed at a variable price per pound for the life of the Project ranging from $39.25 to $72.50 per pound. This price is based on a combination of RBC Capital Markets, Dundee Capital Markets, J.P. Morgan Securities, Raymond James Ltd. and the actual commitments URE has in place. Sensitivities to uranium price are shown in Figure 14.
Uranium recovery from the mineral resource is assumed based on an estimated wellfield recovery factor of 80%. The production rate assumes an average solution uranium grade (head grade) of approximately 47 mg/L. The sales for the cash flow are developed by applying the recovery factor to the resource estimate for the Project. The total uranium production over the life of the Project is estimated to be 9.2 million pounds.
22.2 Cash Flow Forecast and Production Schedule
This document incorporates the Project start date of August 2, 2013 and incorporates production up to the cutoff time for this PEA (August 31, 2013). The NPV assumes cash flows take place in the middle of the periods and is calculated based on a discounted cash flow. The production estimates and OPEX cost distribution used to develop the cash flow are based on the production and restoration models developed by URE and incorporated in the cash flow (Table 13). The cash flow assumes no escalation, no debt interest or capital repayment. It should be noted that Ur-Energy Inc., through its wholly-owned subsidiary Lost Creek ISR, LLC, is the recipient of a State of Wyoming Taxable Industrial Development Bond (URE News Release, October 24, 2013). Debt interest and repayment of this bond is not included in the economic analysis. It also does not include depreciation. The initial capitalized Project construction was completed prior to the writing of this PEA. The estimated payback is in the second quarter of 2015, and generates net cash flow before income tax over the life of the Project of $319.7 million. It is estimated that the Project has an IRR of 74.5% and an NPV of $198.3 million applying an 8% discount rate (Table 13). The estimated cost of uranium produced is $29.13 per pound including severance taxes plus all operating and capital costs. The Net Present Value (NPV) for three discount rates has been calculated and is presented in Table 14. The estimated Internal Rate of Return (IRR) is also presented.
Table 14: Net Present Value versus Discount Rate and IRR
| Discount Rate | NPV ($US 000s) | |
| 5 % | $ 236,238 | |
| 8 % | $ 198,265 | |
| 10 % | $ 176,809 | |
| IRR | 74.5% | |
| 22.3 | Taxation |
The current Wyoming severance tax for uranium is 4.0% but after the wellhead deduction it is approximately 3.0% of gross sales. In addition, the ad valorum (gross products) tax varies but is anticipated to average 6.4%. In aggregate and based on the taxable portion of the product, the total tax averages approximately 5.9% of gross sales. At the federal level, profit from mining ventures is taxable at corporate income tax rates. For mineral properties, depletion tax credits are available on a cost or percentage basis, whichever is greater.
| 76 |
The Lost Creek Property economic analysis includes tax estimates for state severance taxes, county ad valorem taxes and property taxes, all of which are directly attributable to the Property. Federal income tax is excluded. Ur-Energy USA Inc. files consolidated federal tax returns in the United States and had approximately $59.2 million in tax loss carry forwards as of December 31, 2012. The Company does not anticipate paying federal income taxes until the existing, and any future, tax loss carry forwards are utilized. In addition, reclamation costs can be deducted in the early years of the project, thus also pushing out the tax liability. Estimating federal income taxes for the Lost Creek Property therefore becomes speculative and, as a result, has not been included in this Preliminary Economic Analysis.
| 22.4 | Sensitivity Analysis |
The Property is sensitive to changes in the price of uranium as shown in Figure 14. A 5% change in the spot commodity price results in a $15.2 million change to the NPV at a discount rate of 8%. This analysis is based on a variable commodity price per pound. The Property is also slightly sensitive to changes in OPEX costs. A five percent variation in OPEX results in a $6.0 million variation in NPV. A five percent variation in CAPEX results in a $0.07 million variation to the NPV. This analysis is based on an 8% discount rate and a variable commodity price per pound.
| 23.0 | Adjacent Properties |
Adjacent Properties refers to non-URE mineral properties of interest in close proximity to the Lost Creek Property and should not be confused with term Adjoining Projects. Several mineral properties adjacent to the Lost Creek Property contain significant uranium mineral. Most significant of these is the Sweetwater Mill and Mine, now owned by Rio Tinto Americas, Inc. (Figure 2). The facility lies about three and one-half miles south of the southwestern-most boundary of the Lost Creek Project and consists of a conventional uranium mill and reclaimed open-pit mine, both of which are currently non-operational. The deposit was discovered in the 1970s by Minerals Exploration Company. Original estimates of resources were as much as 15 million pounds at an average grade of 0.046% eU3O8 (Sherborne, et al., 1981). This is an historical estimate derived before standards were developed under NI 43-101, and reliability of the estimate has not been independently verified. Production ceased in approximately 1982 after yielding 1.29 million pounds of uranium.
The ENQ deposit is located just to the west of the Sweetwater trend (Sherborne, et al., 1981). It occupies a sand layer immediately above that hosting the Sweetwater trend and exhibits similar grades. Both the ENQ and Sweetwater deposits are hosted by the Battle Spring Formation in stratigraphic intervals approximately the same as those hosting the Lost Creek MMT and EMT. The ENQ deposit is currently controlled by Rio Tinto.
This Preliminary Economic Assessment addresses only property and deposits controlled by URE and not the Adjacent Properties identified in Figure 2. The information and the data from the Adjacent Properties have not been verified and are not necessarily indicative of the mineralization on the Property that is the subject of this Preliminary Economic Assessment.
| 24.0 | Other Relevant Data and Information |
There is no other relevant data or information to include.
| 25.0 | Interpretation and Conclusions |
This independent PEA for the Property has been prepared in accordance with the guidelines set forth in NI 43-101. Its objective is to disclose recent material change for the Property which comes in the form of an updated mineral resource estimate prompted by recent drilling, including initial wellfield installation at the Property. This PEA has been prepared to evaluate the impact of the additional identified resources. This report therefore serves to replace the most recent PEA for the Lost Creek Property dated April 30, 2012 and covers recent activities conducted through August 31, 2013.
| 77 |
NI 43-101 requires an independent review if the total mineral resource has increased by more than 100% since the last independent review. For the Property, the last independent review was issued March 16, 2011 (TREC, 2011). Since that report, URE has recognized increased mineral resources at the Lost Creek Property of 66% in the Measured and Indicated categories and 505% in the Inferred category.
Since the last PEA, dated April 30, 2012, the Measured and Indicated resources for the Lost Creek Property have increased by 4% and Inferred resources increased by 65%.
The Lost Creek PROPERTY represents the composite of six individual contiguous PROJECTS:
Lost Creek Project
LC East Project
LC West Project
LC North Project
LC South Project
EN Project
The Lost Creek Project is considered the core project while the others are collectively referred to as the Adjoining Projects.
The Lost Creek Project has progressed to the production stage. Construction began in mid-October 2012 and production commenced in the first Mine Unit (MU1) on August 2, 2013, continuing to ramp up to full capacity. Development activities in MU2 have been initiated with the installation of the necessary complement of monitor wells. Wellfield development of MU1 identified more resources than originally estimated. Conversely, resources in MU2 were reduced to be consistent with current interpretation and estimation criteria. Permitting activities continue with the goal of expanding production in the future to include the KM Horizon within the MMT at the Lost Creek project and also the HJ and KM Horizons within the EMT at LC East.
| 25.1 | Risk Assessment |
Resource and Recovery
Bench-scale tests have been performed on various core samples from the Project, as discussed in Section 13. The most significant potential risks to meeting the production results presented in this PEA will be associated with the success of the wellfield operation and recovery of uranium from the targeted host sands. The estimated quantity of recovered uranium used in this PEA is based primarily on the recovery data from site-specific, bench-scale testing of mineralized samples. The recovery factor of 80%, used herein, is relatively typical of industry experience for wellfield recovery. The Authors can provide no assurance that recovery of the resources presented herein will be achieved. This PEA is based on the assumptions and information presented herein. A potential problem that could occur in the wellfield recovery process is unknown or variable geochemical conditions resulting in uranium recovery rates from the mineralized zones that are significantly different than previous bench-scale tests.
Another potential concern is reduced hydraulic conductivity in the formation due to chemical precipitation or lower hydraulic conductivities than estimated, high flare and/or recovery of significant amounts of groundwater, the need for additional injection wells to increase uranium recovery rates, variability in the uranium concentration in the host sands and discontinuity of the mineralized zone confining layers. The risks associated with these potential issues have been minimized to the extent possible by extensive delineation and hydraulic studies of the site.
| 78 |
Markets and Contracts
The marketability of uranium and acceptance of uranium mining are subject to numerous factors beyond the control of URE. The price of uranium may experience volatile and significant price movements over short periods of time. Factors known to affect the market and the price of uranium include demand for nuclear power; political and economic conditions in uranium mining, producing and consuming countries; costs; interest rates, inflation and currency exchange fluctuations; governmental regulations; availability of financing of nuclear plants, reprocessing of spent fuel and the re-enrichment of depleted uranium tails or waste; sales of excess civilian and military inventories (including from the dismantling of nuclear weapons) by governments and industry participants; production levels and costs of production in certain geographical areas such as Russia, Africa and Australia; and changes in public acceptance of nuclear power generation as a result of any future accidents or terrorism at nuclear facilities.
Unlike other commodities, most uranium does not trade on an open market. Contracts are negotiated privately by buyers and sellers. Changes in the price of uranium can have a significant impact on the economic performance of the Project. As discussed in Section 22.4, a 5% change in the spot commodity price results in a $14.3 million change to the NPV at a discount rate of 8%. This analysis assumes a fixed price per pound for U3O8 over the life of the Project. This PEA assumes U3O8 production is sold at a variable price per pound for the life of the Project ranging from $39.25 to $72.50. This price is based on a combination of RBC Capital Markets, Dundee Capital Markets, J.P. Morgan Securities, Raymond James Ltd. and the actual commitments URE has in place. The Authors believe these estimates are appropriate for use in this evaluation.
Operations
Some operational risks such as reagents, power, labor and/or material cost fluctuations exist in the Project implementation and could impact the OPEX and Project economic performance. These potential risks are generally considered to be addressable either though wellfield modifications or Plant optimization. The Plant has been constructed as a batch precipitation and drying operation, which allows for process variations and enhanced control.
The IX and elution processes have been, and are being used at other ISR facilities in Wyoming, Texas, and Nebraska. The process does not use any unusual methods and the reagents for the process are readily available from regional sources. Initial process optimization will be required to minimize the use of reagents, minimize loss of product and ensure proper product quality.
Health and safety programs will be implemented to control the risk of on and off site exposures to uranium, operational incidents and/or process chemicals. Standard industry practices exist for this type of operation and novel approaches to risk control and management will not be required.
| 25.2 | Conclusions |
The Authors have weighed the potential benefits and risks presented in this report and have found the Property to be potentially viable and meriting further evaluation and exploration.
| 26.0 | Recommendations |
The Authors find the Property is potentially viable based on the assumptions contained herein. There is no certainty that the mineral recovery or the economics presented in this PEA will be realized. In order to realize the full potential benefits described in this PEA, the following activities are required, at a minimum:
| 79 |
| 26.1 | Development |
Further Delineation of Mine Units and Resource Areas
Final delineation of Mine Unit 2 should be accomplished concurrently with installation of production pattern wells. Delineation of subsequent near term production areas should occur as well in a time frame to allow adequate planning for monitoring and well installation. This includes delineation drilling in LC East as well. Costs for this are included in the Cash Flow, Table 13, and are estimated at $600,000.
LC East Activities
At LC East, delineation drilling of identified resources in the EMT should be continued in order to upgrade resources into the Measured plus Indicated classification, and to facilitate production planning and permitting. This drilling is also included in the section and costs above. This activity should include a coring program of three to five core-holes to confirm resource leachability and host rock characteristics within the EMT. Total additional costs for laboratory testing will be approximately $45,000.
Baseline studies at LC East should continue toward the goal of permitting the EMT for future production. This will be accompanied by baseline and regional pump testing. Total costs to accomplish these goals is estimated to be approximately $325,000 and is also included in the economic assessment.
Permit Area Amendments
URE should continue with its submittal of applications to amend the Lost Creek Permit to Mine and NRC License to allow production of the KM Horizon at the Lost Creek Project, and also to extend production into the HJ and KM Horizons at LC East Project area. This is estimated to cost approximately $300,000 and is included in the cash flow as a regulatory cost.
| 26.2 | Exploration |
The Authors also recommend the following activities to potentially extend the life of the Project and develop additional resources. They are recommendations for further development of currently known resources and there is no certainty that the activities described below will enhance mineral resources or result in improved economics.
Investigation of the FG Horizon
Resources in the FG Horizon in the Lost Creek Project should be further investigated and tested for continuity, quality, disequilibrium and leachability in order to make a more informed decision for mine planning. Total of approximately 250 drill holes is anticipated for these activities costing approximately $1.25 million.
Exploration of LC East
Exploration drilling should continue in the northern portions of LC East. Targets should be identified and prioritized to best establish continuity of the mineral in areas of less dense drilling. The goal will be to test potential mineralization along mapped roll fronts sufficiently as to allow upgrade of that mineral into the Inferred category. This will require about 300 drill holes costing a total of approximately $1.05 million.
Exploration of Lost Creek, LC North and LC West
Near term exploration activities should initially focus on the northeastern and western portions of the Lost Creek Project and also the eastern portions of the LC North Project and northern portions of LC West. All of these areas represent potential for direct extensions of the MMT in the HJ and KM Horizons. The goal is to bring all of the viable mineral in these areas to the Inferred category or better in order to facilitate a production decision as soon as possible. Drilling in both the northeastern portion of the Lost Creek Project and the western portion of LC North will require an estimated 300 exploration holes costing approximately $2.7 million to bring viable resources in those areas to the Inferred category.
| 80 |
Exploration of LC South
Exploration in the LC South Project should initially focus on testing the extent of FG trends by drilling those targets on spacing sufficient to bring all of those resources to the Inferred category. The goal is to assess the viability of those resources as potential feed to the Lost Creek facility. At the same time, more exploration drilling is warranted for the HJ, KM and Deep Horizon targets within the Project. This should be accomplished using a wide spaced fence-line drilling approach to facilitate an initial assessment of e viability of any resources in those horizons. The LC South program is estimated to require approximately 400 drill holes at a cost of approximately $3.6 million.
Exploration of the EN Project
The EN Project should be explored further, focusing initially on wide spaced framework drilling to assess regional alteration and stratigraphic relationships. This should then be followed by wide spaced fence-line drilling to test for mineralization on any alteration fronts identified by the framework drilling. This may require an estimated 150 holes costing approximately $1.5 million. The greater costs for drilling at the EN Project are due to greater depths. At the conclusion of the drilling, management should determine if the roll fronts are of sufficient quality to merit additional exploration and delineation.
Exploration of the Deep Horizons
Continued testing of the Deep Horizons in the northeastern portion of the Lost Creek Project and the Adjoining Projects should be completed as a secondary goal to identify longer term resources in those units.
| 81 |
| 27.0 | References |
Armistead, Tom, 2013, Uranium Investors, Ignore The Noise! Fundamentals Are Compelling. The Energy Report, pages 1-6, October 29, 2013.
Boberg W.W., 2010, The Nature and Development of the Wyoming Uranium Province. SEG Special Publication 15, pages 653-674.
CIM Council, 2003, Estimation of Mineral Resources and Mineral Reserves, Best Practice Guidelines, Uranium Specific Guidelines. http://www.cim.org/UserFiles/File/Best-Practice-Uranium-Estimation-Guidelines.pdf [online document]. Last Accessed April 20, 2012.
CIM Council, 2010, CIM Definition Standards For Mineral Resources and Mineral Reserves
http://www.cim.org/UserFiles/File/CIM_DEFINITON_STANDARDS_Nov_2010.pdf [online document]. Last accessed April 20, 2012.
Collentine M., Libra R., Feathers K., Hamden L., 1981, Occurrence and characteristics of ground water in the Great Divide and Washakie Basins, Wyoming. Wyoming Water Research Institute. Technical Report Vol. VI-A.
Curtis J.C. and Grimes K., 2004, Wyoming Climate Atlas. Wyoming State Climate Office. No. 1.2.1 http://www.wrds.uwyo.edu/sco/climateatlas/title_page.html [website]. Last accessed April 20, 2012.
Dundee, 2013, Dundee Capital Markets, RMB Debt Retired As State Financing Comes In. October 24, 2013
Fisk EP, 1967, Groundwater geology and hydrology of the Great Divide and Washakie Basins, south-central Wyoming [master's thesis]. [Los Angeles (CA)]: University of Southern California.
Hazen, 2007, Characterization of Uranium Occurrence in Sandstone Samples [Ur-Energy], Hazen Project 10619. August 24, 2007.
Honea R., 1979a, TT-147 Petrographic Report. Report ID: URLC4.
Honea R., 1979b, Lost Creek – Honea Petrographic Description TT-152. Report ID: NF LC-1121.
Hydro-Engineering, LLC, 2007, Lost Creek aquifer test analyses. Prepared for Ur-Energy USA, Inc. March 2007.
Hydro-Search, Inc. 1982, 1982 Hydrogeology program for the Conoco/Lost Creek uranium project. Golden (CO). Prepared for Texasgulf, Inc.
J.P. Morgan, 2013, J.P. Morgan Chase and Co., Global Metals And Mining, October 8, 2013.
Lyntek, Inc., 2008, Amended NI-43-101 Preliminary Assessment for the Lost Creek Project Sweetwater County, Wyoming. John I Kyle P.E., Douglas K. Maxwell P.E., April 2nd, 2008, as amended February 25, 2011 (As amended, with C. Stewart Wallis, P.Geo., co-author).
Maxim Technologies, Inc. / Tetra Tech Inc. 2005a, Geotechnical Test Summary. Prepared for Ur-Energy by Energy Laboratories, Inc. Project Number 6550913. Report Number 8468. October 24, 2005.
| 82 |
Maxim Technologies, Inc. / Tetra Tech Inc. 2005b, Geotechnical Test Summary. Prepared for Ur-Energy Inc. by Energy Laboratories, Inc. Project Number 6550913. Report Number 8519. December 8, 2005.
Maxim Technologies, Inc. / Tetra Tech Inc. 2006, Geotechnical Test Summary. Prepared for Ur-Energy Inc. by Energy Laboratories, Inc. Project Number 6550913. Report Number 8547. January 5, 2006.
Petrotek Engineering Corporation, 2007, “Lost Creek Regional Hydrologic Testing Report – Lost Creek Project Sweetwater County, Wyoming”. Report by Petrotek Engineering Corporation, October, 2007.
Pipiringos, G.N and Denson, N.M., 1970, The Battle Spring Formation in South-Central Wyoming, Wyoming Geological Association 1970 Guidebook
Roscoe Postle Associates (RPA), 2005, Technical Report on the Great Divide Basin Uranium Properties, Wyoming, Prepared for Ur-Energy Inc.; Stewart Wallis, June 15, 2005, Revised October 15, 2005.
Roscoe Postle Associates (RPA), 2006, Technical Report on the Lost Creek Project, Wyoming,
NI 43-101 Prepared for Ur-Energy Inc.; Stewart Wallis, June 15, 2006.
Rubin, B., 1970, Uranium Roll-Front Zonation in the Southern Powder River Basin, Wyoming:
Wyoming Geological Society Earth Science Bull., Vol. 3, No. 4,
RBC, 2013, RBC Dominion Securities Inc., RBC Capital Markets, Uranium Market Outlook – Third Quarter 2013, June 18, 2013.
Sherborne, J.E., Jr.; Pavlak, S.J.; Peterson, C.H.; and Buckovic, W.A. 1981, Uranium Deposits of the Sweetwater Mine Area, Great Divide Basin, Wyoming: Third Annual Uranium Seminar, AIME, pp.27-37]
SKM, 1997. Red Desert Project Scoping Evaluation, 1997, Stephen Morzenti / SKM Associates, for Strathmore Resources.
TREC, Inc., March 16, 2011, Preliminary Economic Assessment, Lost Creek Property, Sweetwater County, Wyoming.
Ur-Energy Inc., 2007a, Lost Creek ISR, LLC, Lost Creek ISR Project, Wyoming DEQ Permit to Mine Application, December, 2007.
Ur-Energy Inc., 2007b, Lost Creek ISR, LLC, Application for US NRC Source and Byproduct Material License (Docket No. 40-9068), Technical Report, October, 2007.
Ur-Energy Inc., 2012a, Preliminary Economic Assessment of the Lost Creek Property, Sweetwater County, Wyoming, February 29, 2012
Ur-Energy Inc., 2012b Preliminary Economic Assessment of the Lost Creek Property, Sweetwater County, Wyoming, April 30, 2012.
U.S. Census
Bureau 2010 Report on Carbon County, WY
http://quickfacts.census.gov/qfd/states/56/56007.html [website]. Last accessed April 20, 2012.
| 83 |
U.S. Census
Bureau 2010 Report on Sweetwater County, WY
http://quickfacts.census.gov/qfd/states/56/56037.html [website]. Last accessed April 20, 2012
Weatherford, 2010, Summary of Routine Core Analysis Results. Prepared for Ur-Energy Inc. by Energy Laboratories, Inc. Report Number C10010037. March 1, 2010.
Welder, G.E. and McGreevey L.J., 1966, Groundwater Reconnaissance of the Great Divide and Washakie Basins and Some Adjacent Areas, Southwestern Wyoming: U.S. Geol. Survey Hydro. Investigations Atlas HA-219, 10 pages, 3 Sheets.
| 84 |
| 28.0 | Certificates |
CERTIFICATE OF QUALIFIED PERSON
I, Douglass H. Graves, P.E., of 1800 West Koch, Bozeman, Montana, USA, do hereby certify that:
| · | I have been retained by Ur-Energy Inc., 5880 Enterprise Road, Evansville, Wyoming, USA, to manage, coordinate and develop the documentation for the Lost Creek Property, Preliminary Economic Assessment. |
| · | I am a principal of TREC, Inc., 1800 West Koch, Bozeman, Montana, USA. |
| · | I graduated with a Bachelor of Science degree in Watershed Sciences from Colorado State University in 1975. |
| · | I graduated with a Bachelor of Science degree in Civil Engineering from Montana State University in 1982. |
| · | I am a Professional Engineer in Wyoming, Montana, Colorado, South Carolina, Arizona, Idaho, Michigan, Oklahoma and Missouri, a P. Eng. in Alberta, Canada and a member of the Society for Mining, Metallurgy and Exploration (SME), Mining Associates of Wyoming (MAW), Montana Mining Association (MMA), Northwest Mining Association (NWMA) and the American Institute of Steel Construction (AISC). |
| · | I have worked as a consulting Engineer for 35 years. My experience has encompassed infrastructure design, mine construction oversight, cost estimating and control, economic analyses, equipment selection, design, construction management and mine closure/reclamation for numerous metal mining operations and conventional uranium and ISR facilities. |
| · | I have read the definition of “qualified person” set out in National Instrument (NI) 43-101 and certify by reason of my education, professional registration and relevant work experience, I fulfill the requirements to be a “qualified person” for the purposes of NI 43-101. |
| · | I visited the Lost Creek project site on April 24, 2013 and was there for approximately eight hours. I have read the NI 43-101 and the Lost Creek Property Preliminary Economic Assessment which has been prepared in accordance with the guidelines set forth in NI 43-101 and Form 43-101F1. |
| · | I am responsible for the preparation of all or part of Sections 1, 2, 3, 4, 5, 6, 13, 16, 17, 18, 19, 20, 21, 22, 23, 24, 25, 26, 27 and 29 of the report entitled “Preliminary Economic Assessment of the Lost Creek Property, Sweetwater County, Wyoming, December 30, 2013”. |
| · | To the best of my knowledge, information and belief, at the effective date of the report, the Preliminary Economic Assessment contains all scientific and technical information that is required to be disclosed to make the Preliminary Economic Assessment not misleading. |
| · | I am independent of the issuer applying all of the tests of NI 43-101. |
| · | I was an author for the previous PEA submitted for this project on March 16, 2011 and was the engineer of record for the design of the Lost Creek Property uranium processing plant. |
| · | I consent to the filing of the technical report with any stock exchange and other regulatory authority and any publication by them, including electronic publication in the public company files on their websites accessible by the public. |
Dated this 30th of December, 2013.
Signed and Sealed
/s/ Douglass H. Graves, Professional Engineer Wyoming PE 4845 and SME Registered Member 4149627
Douglass H. Graves, P.E.
| 85 |
CERTIFICATE OF QUALIFIED PERSON
I, Steven E. Cutler of 4671 Shandalyn Lane, Bozeman, Montana 59718 hereby certify that:
| · | I am a Consulting Geologist, affiliated with Roughstock Mining Services, LLC at 4671 Shandalyn Lane, Bozeman, Montana 59718, USA. I am Professional Geologist, AIPG #11103, in good standing. |
| · | I was awarded a B.S. in Geology from Montana State University, Bozeman, Montana in 1984, and an M.S Degree in Economic Geology from the University of Alaska-Fairbanks, Fairbanks, Alaska in 1993. |
| · | Since 1984 I have practiced continuously as a Geologist, Supervisor, Chief Mine Engineer, Technical Service Manager, and Consultant for mining firms, and other mining consulting firms. This work encompassed a wide variety of mining and metals types, reserve estimation evaluations, mining planning, equipment selection, and cost analyses. I am the author of several publications on subjects relating to the mining industry. |
| · | I have read the definition of “qualified person” set out in National Instrument 43-101 (“NI 43-101”) and certify that by reason of my education, professional registration, affiliation with a professional association, and past relevant work experience, I fulfill the requirements to be a “qualified person” for the purposes of NI 43-101. |
| · | I visited the Lost Creek Property on April 24, 2013 and was on location for approximately eight hours. |
| · | I am responsible for the preparation of all or part of sections 1, 2, 7, 8, 9, 10, 11, 12, 14, 15, 22, 23, and 25 of the of the report entitled “Preliminary Economic Assessment of the Lost Creek Property, Sweetwater County, Wyoming, April 30, 2013. |
| · | As defined in Section 1.5 of National Instrument 43-101, I am independent of the issuer, Ur-Energy Inc. I have had no prior involvement with the property that is the subject of the technical report. |
| · | I have read National Instrument 43-101, Form 43-101F1 and the Preliminary Economic Assessment, which has been prepared in compliance with that Instrument and Form. |
| · | I am not aware of any material fact or change with respect to the subjects of this report which is not reflected in this report, the exclusion of which would make this report misleading. |
| · | As of the date of this Certificate, to the best of my knowledge, information and belief, the Preliminary Economic Assessment contains all the scientific and technical information that is required to be disclosed to make this Technical Report not misleading. |
Dated this 30th day of December, 2013
Signed
/s/ Steve E. Cutler
Certified Professional Geologist and Member 11103 of the American Institute of Professional Geologists
Steve E. Cutler, C.P.G
| 86 |
| 29.0 | Illustrations |
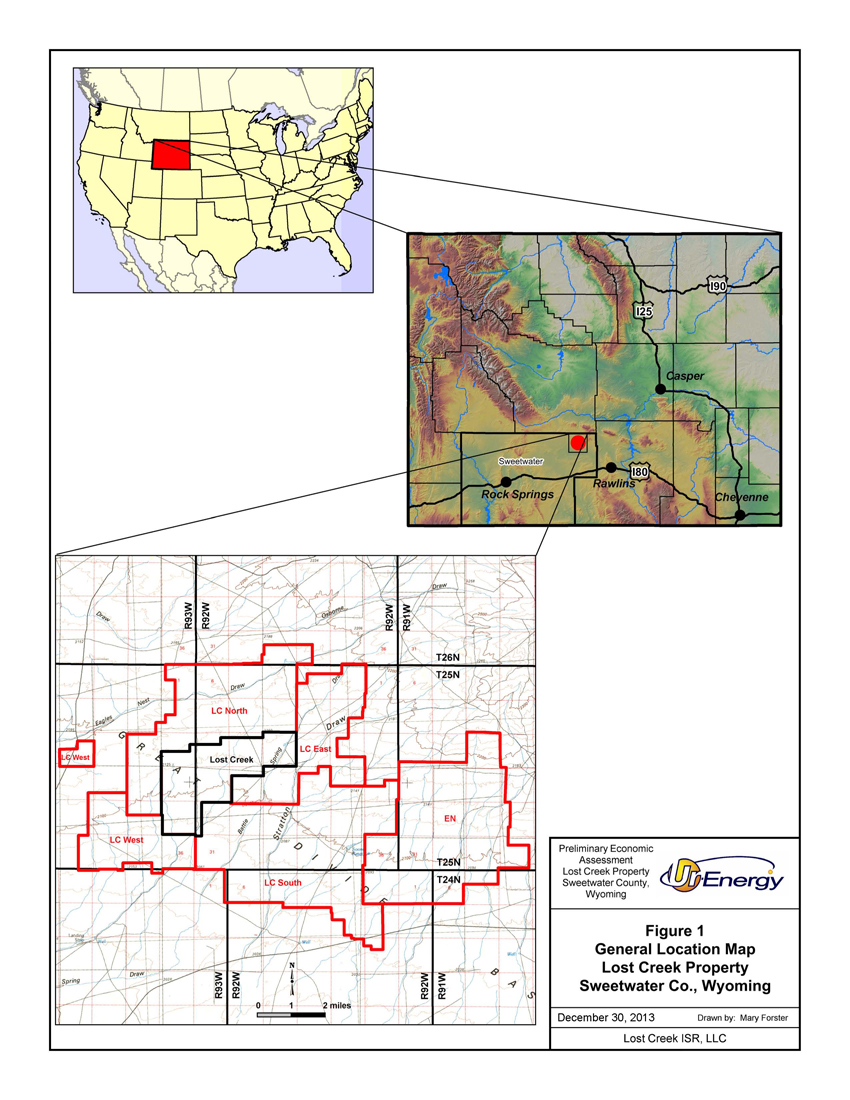
| 87 |
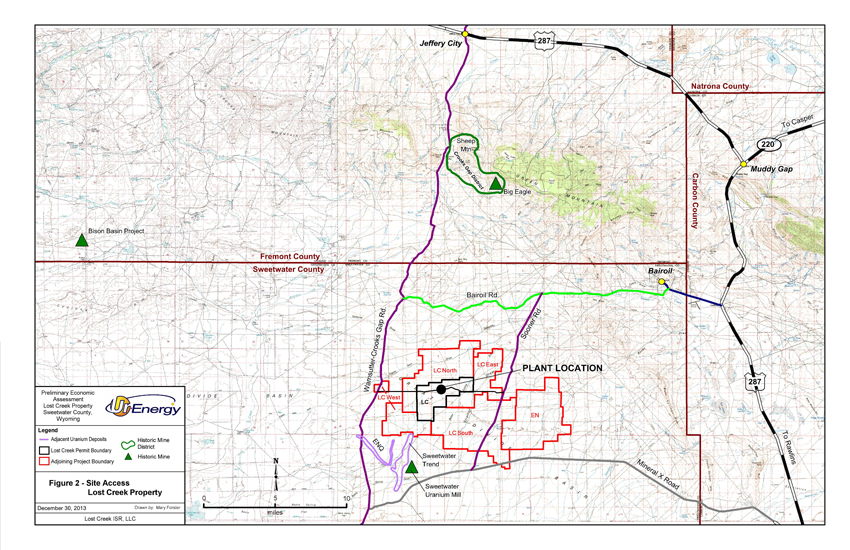
| 88 |
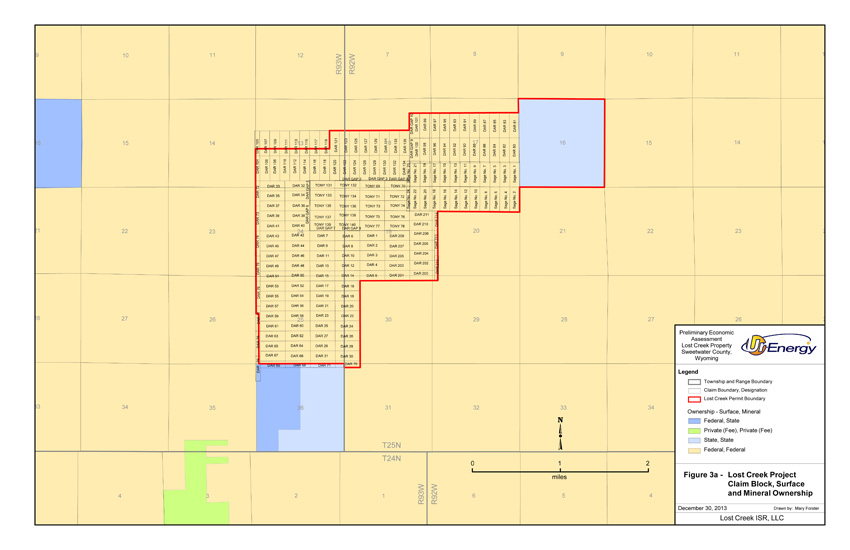
| 89 |
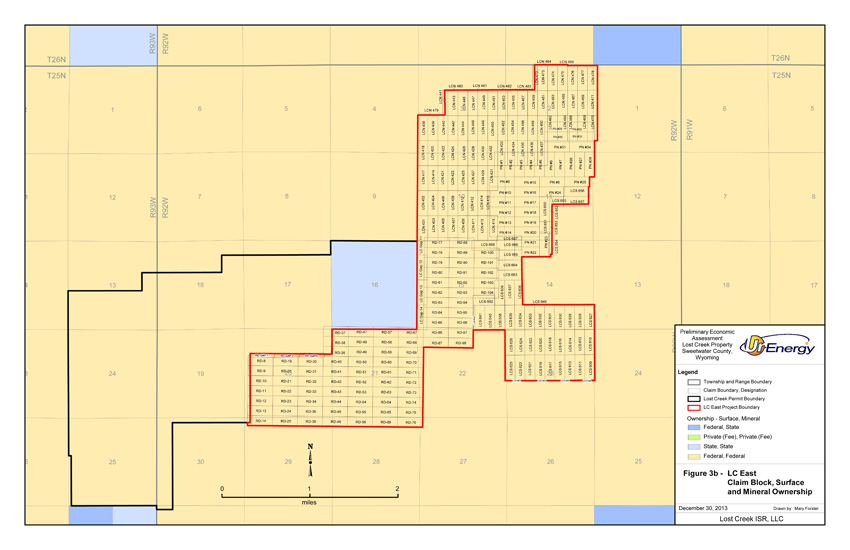
| 90 |
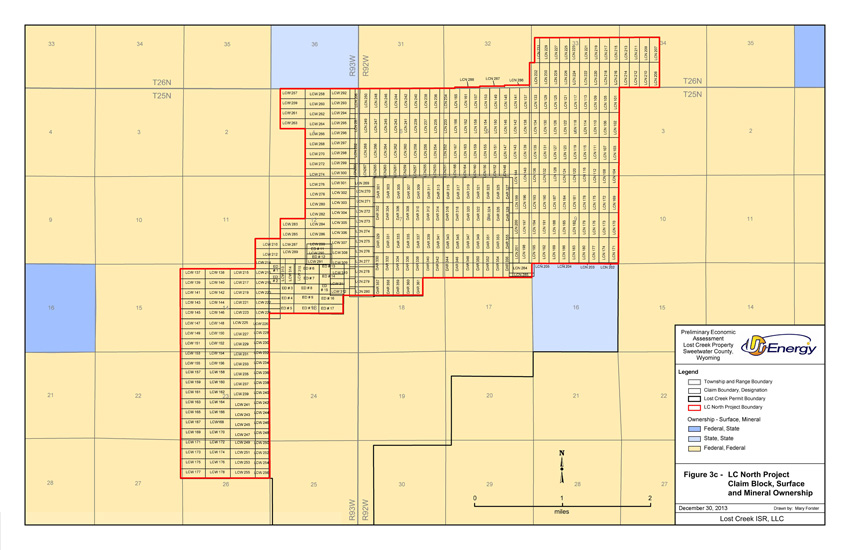
| 91 |
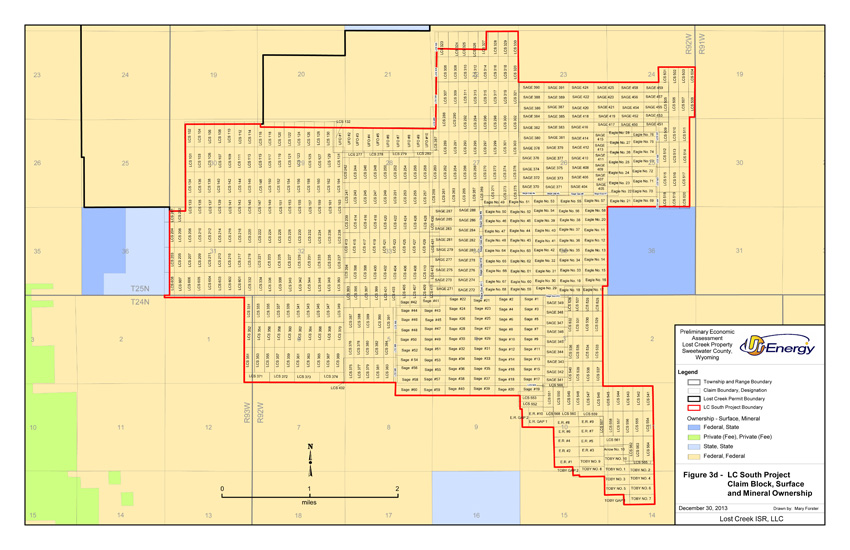
| 92 |
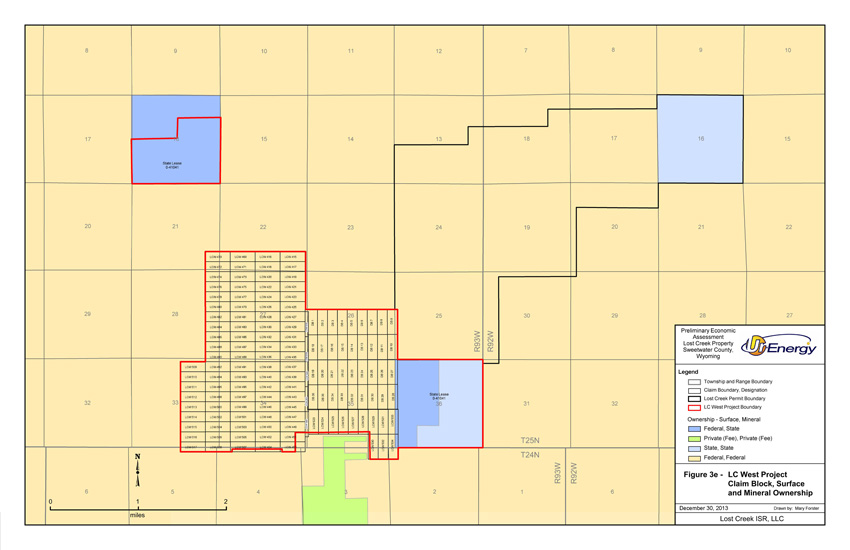
| 93 |
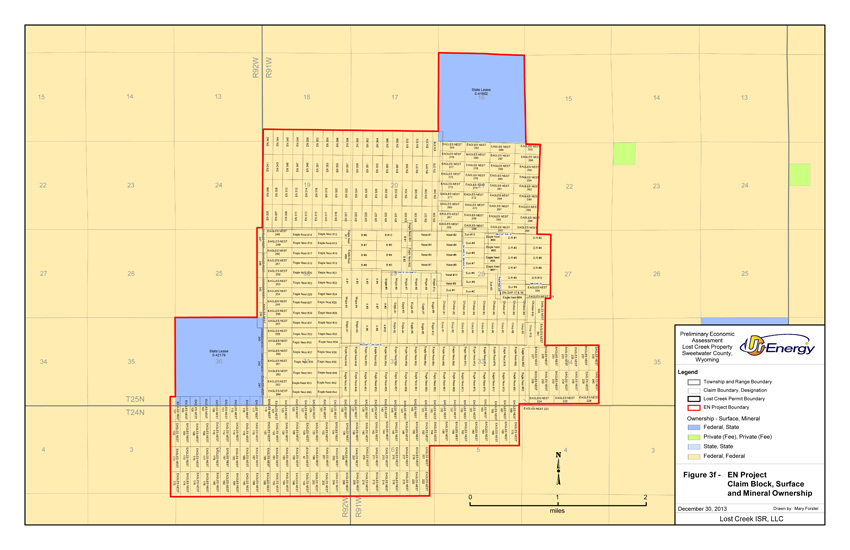
| 94 |
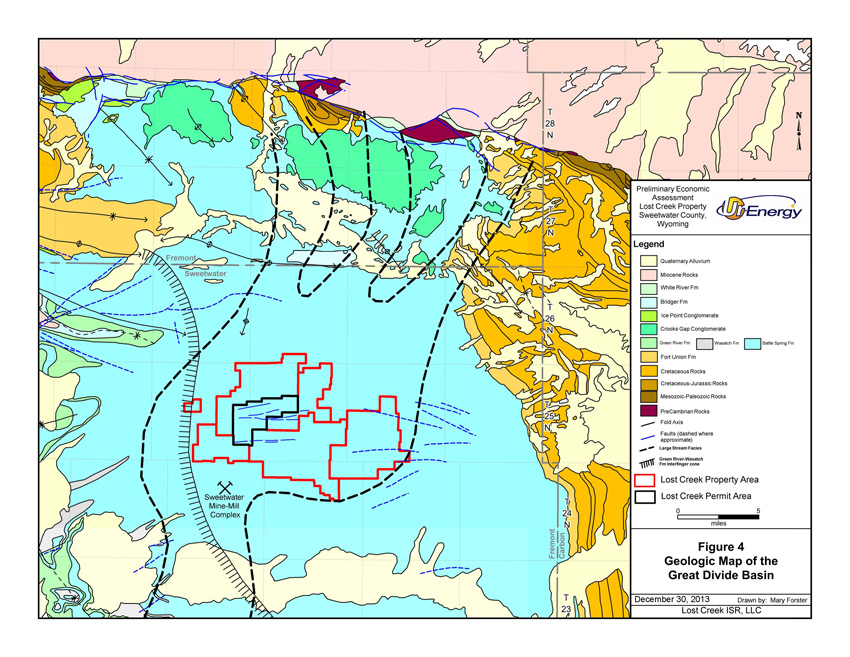
| 95 |
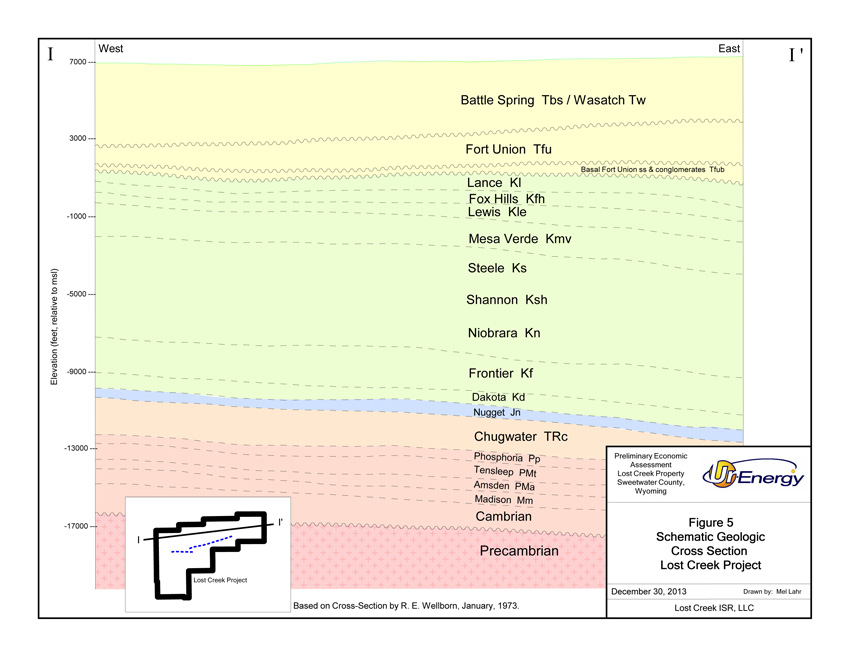
| 96 |
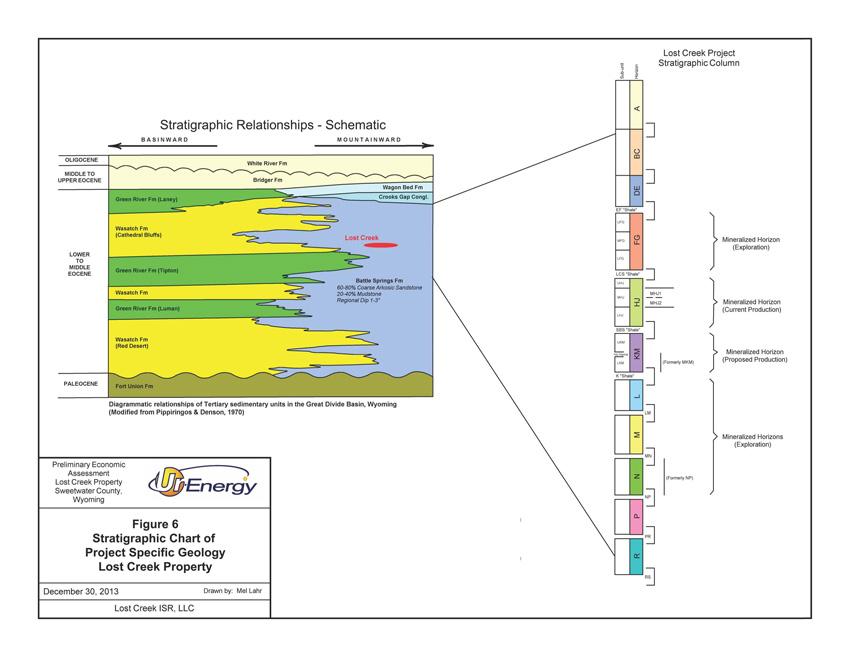
| 97 |
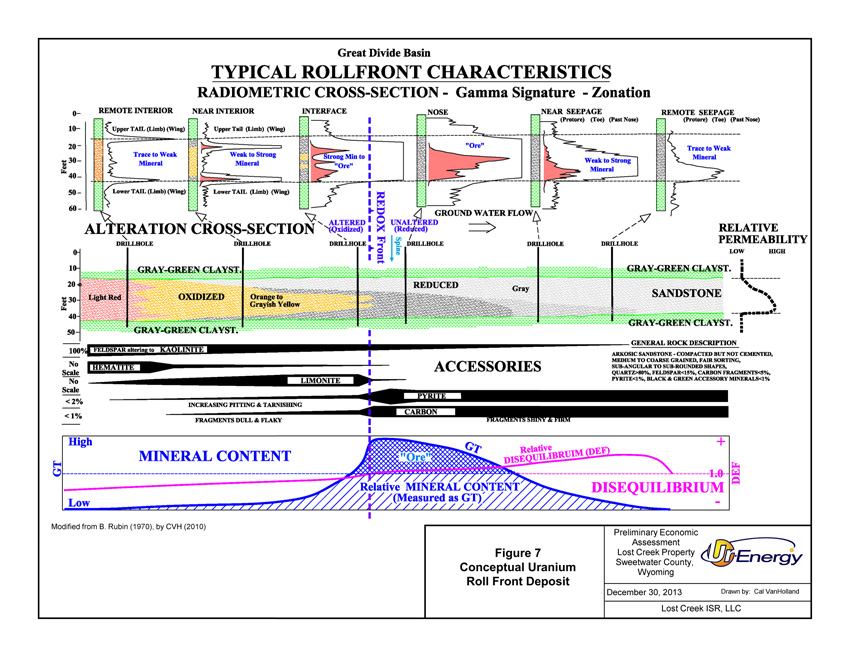
| 98 |
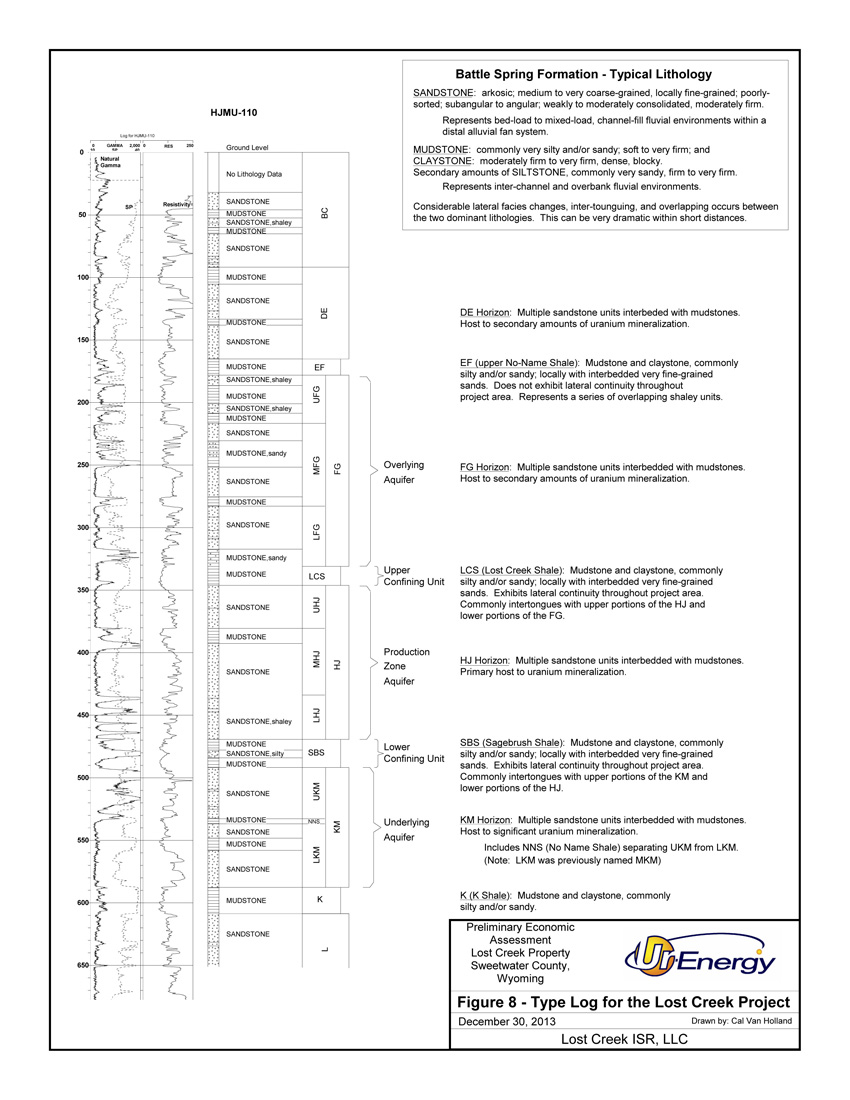
| 99 |
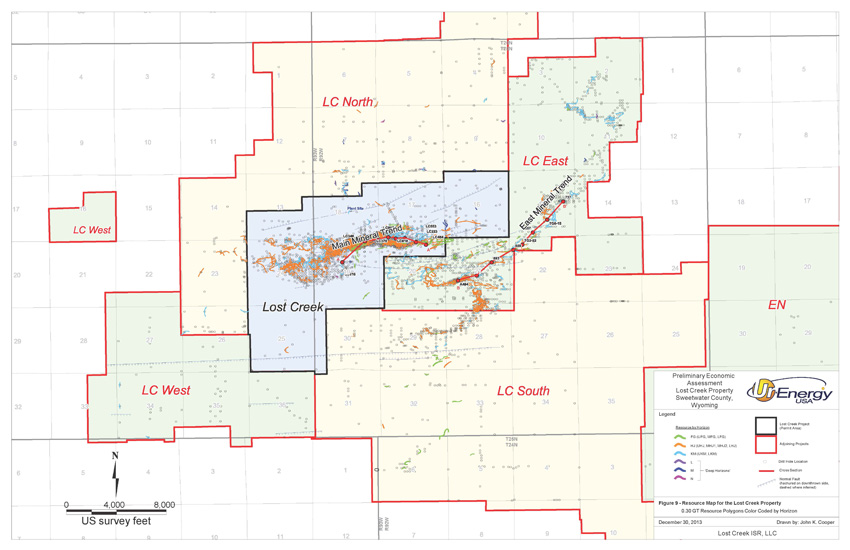
| 100 |
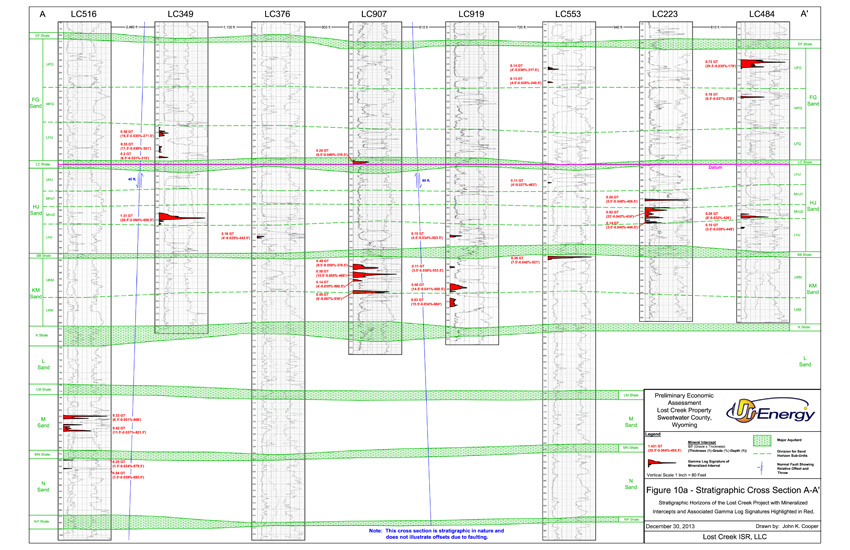
| 101 |
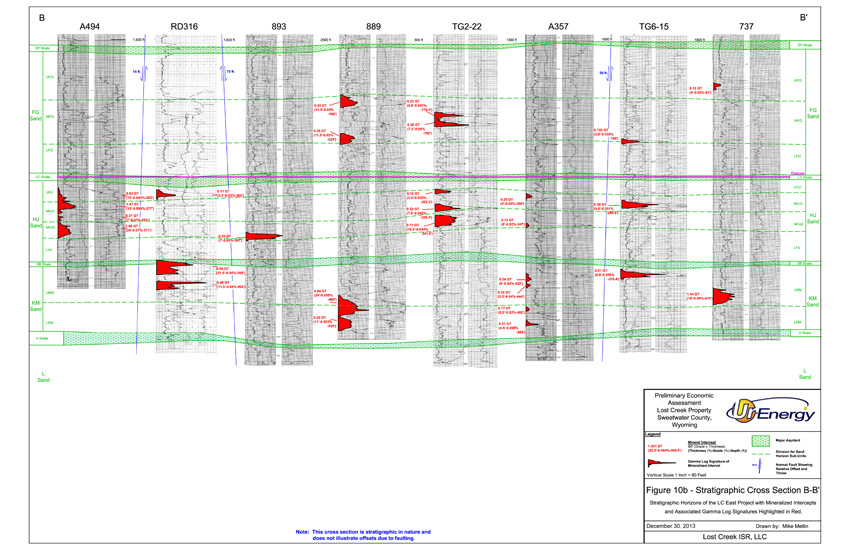
| 102 |
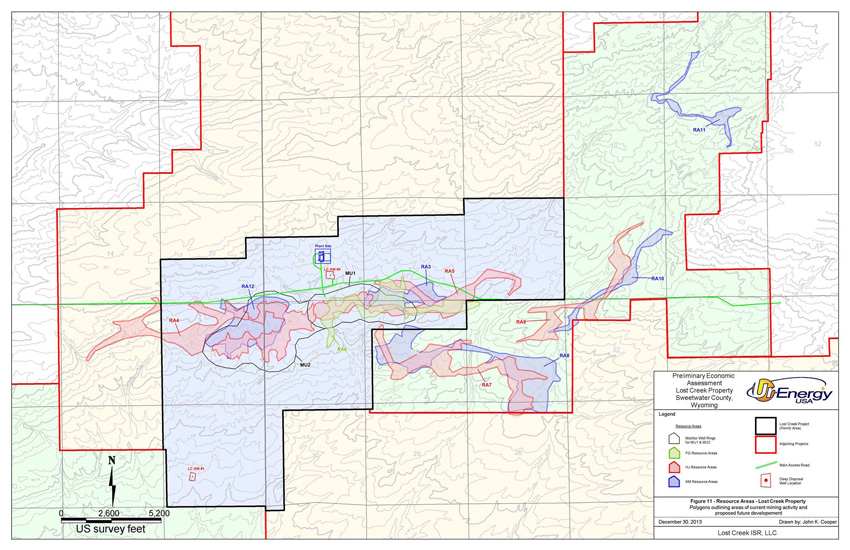
| 103 |
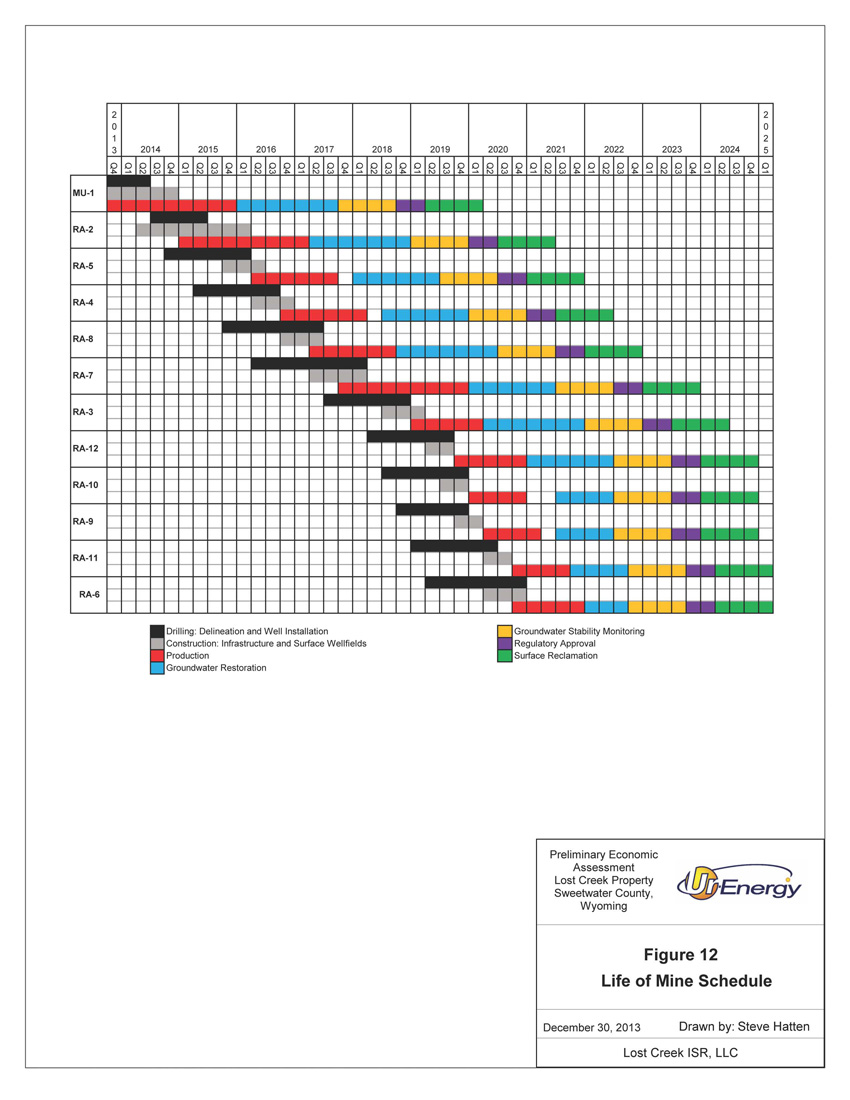
| 104 |
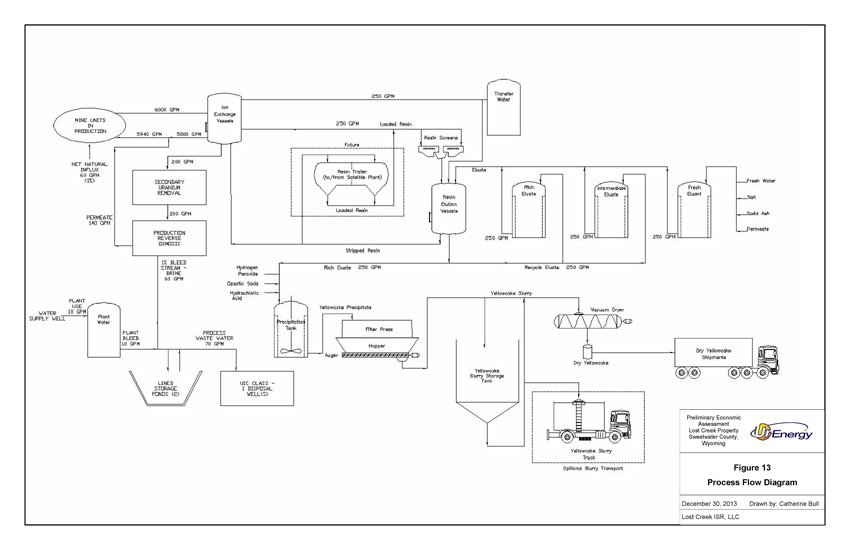
| 105 |
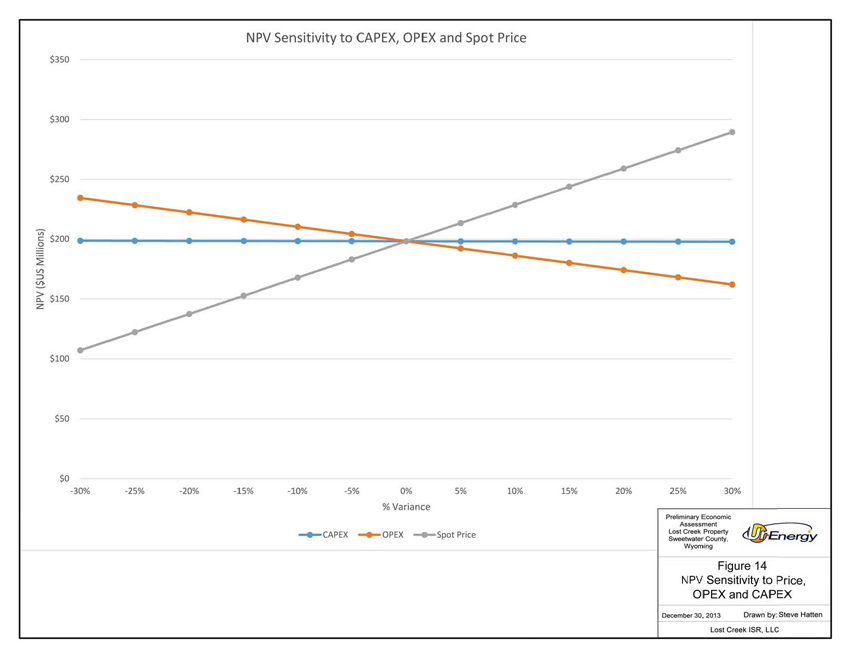
| 106 |