TABLE OF CONTENTS
|
TABLE OF CONTENTS
|
|
|
1.0
|
EXECUTIVE SUMMARY
|
1
|
|
2.0
|
INTRODUCTION
|
4
|
|
3.0
|
RELIANCE ON OTHER EXPERTS
|
5
|
|
4.0
|
PROPERTY DESCRIPTION AND ALLOCATION
|
6
|
|
5.0
|
ACCESSIBILITY, CLIMATE, LOCAL RESOURCES, INFRASTRUCTURE AND PHYSIOGRAPHY
|
8
|
|
6.0
|
HISTORY
|
8
|
|
7.0
|
GEOLOGICAL SETTING
|
9
|
|
8.0
|
DEPOSIT TYPES
|
10
|
|
9.0
|
MINERALIZATION
|
10
|
|
10.0
|
EXPLORATION
|
11
|
|
11.0
|
DRILLING
|
11
|
|
12.0
|
SAMPLING METHOD AND APPROACH
|
20
|
|
13.0
|
SAMPLE PREPARATION, ANALYSES AND SECURITY
|
20
|
|
14.0
|
DATA VERIFICATION
|
21
|
|
15.0
|
ADJACENT PROPERTIES
|
23
|
|
16.0
|
MINERAL PROCESSING AND METALLURGICAL TESTING
|
23
|
|
17.0
|
MINERAL RESOURCE AND MINERAL RESERVE ESTIMATES
|
27
|
|
18.0
|
OTHER RELEVANT DATA AND INFORMATION
|
29
|
|
19.0
|
INTERPRETATION AND CONCLUSIONS
|
29
|
|
20.0
|
RECOMMENDATIONS
|
30
|
|
21.0
|
REFERENCES
|
31
|
|
22.0
|
DATE AND SIGNATURE PAGE
|
32
|
|
23.0
|
ADDITIONAL REQUIREMENTS FOR TECHNICAL REPORTS ON DEVELOPMENT PROPERTIES AND PRODUCTION PROPERTIES
|
36
|
|
24.0
|
ILLUSTRATIONS
|
45
|
|
TABLES
|
|
Table 1‑1: Lost Creek Resources – April 2008
|
1
|
|
Table 1‑2: Economic Indicators
|
4
|
|
Table 11‑1: Significant HJ & KM Intercepts for the Period 2005-2007
|
12
|
|
Table 16‑1: Bottle Roll Leach Test Results – 2005
|
24
|
|
Table 16‑2 Core Sample Metal Values
|
25
|
|
Table 16‑3: Bottle Roll Leach Test Results – 2007
|
26
|
|
Table 17‑1: Lost Creek Resources – April 2008
|
29
|
|
Table 17‑2: Lost Creek Resources – 2006
|
29
|
|
Table 23‑1: Summary of the Economic Analysis
|
42
|
|
Table 23‑2: Economic Indicators
|
43
|
| |
|
| |
|
| |
|
|
FIGURES
|
| |
|
|
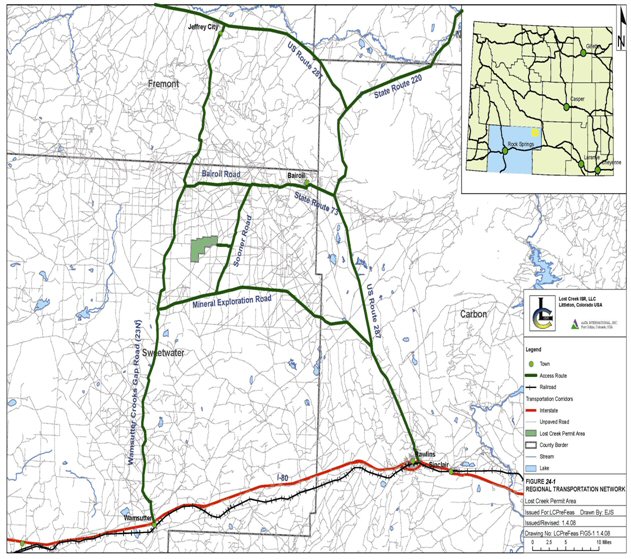
Figure 24‑1: Regional Transportation Network
|
45
|
|
Figure 24‑2: Surface Drainage Map for the Lost Creek Project Area
|
45
|
|
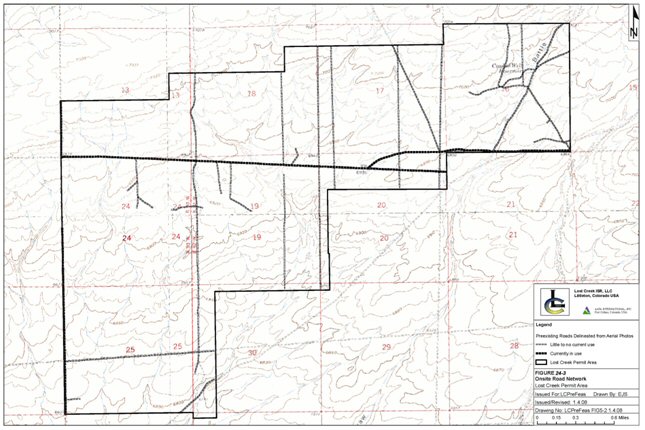
Figure 24‑3:Onsite Road Network
|
46
|
|
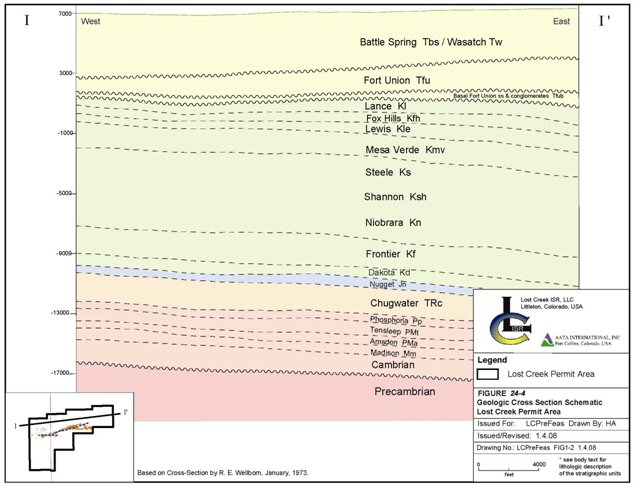
Figure 24‑4: Geologic Cross Section Schematic Lost Creek Permit Area
|
47
|
|
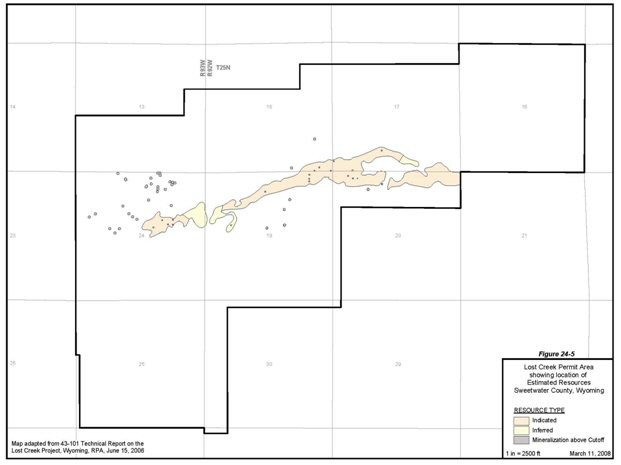
Figure 24‑5: Lost Creek Permit Area showing location of Estimated Resources
|
48
|
|
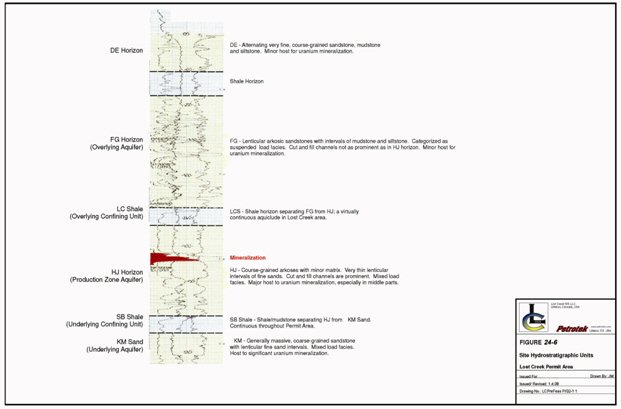
Figure 24‑6: Site Hydrostratigraphic Units
|
50
|
|
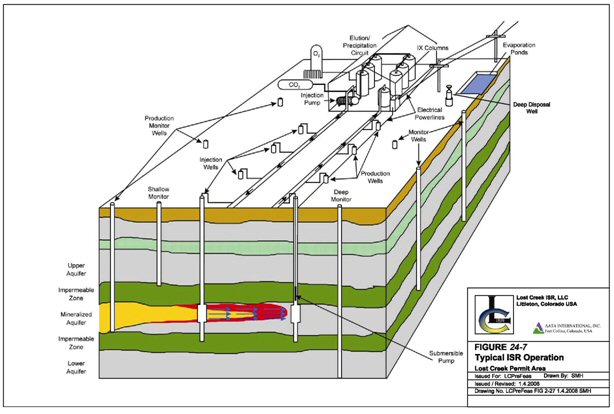
Figure 24‑7: Typical ISR Operation
|
51
|
|
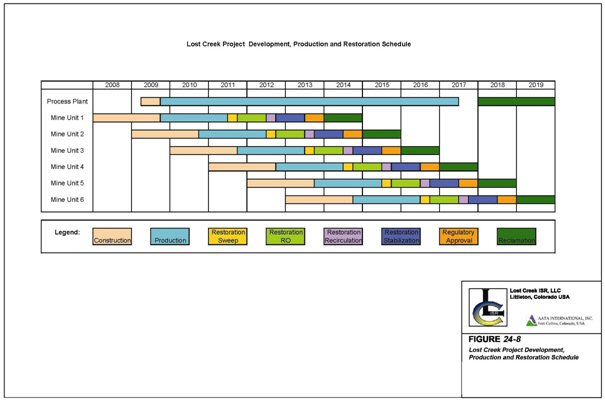
Figure 24‑8:Lost Creek Project Development, Production and Restoration Schedule
|
52
|
|
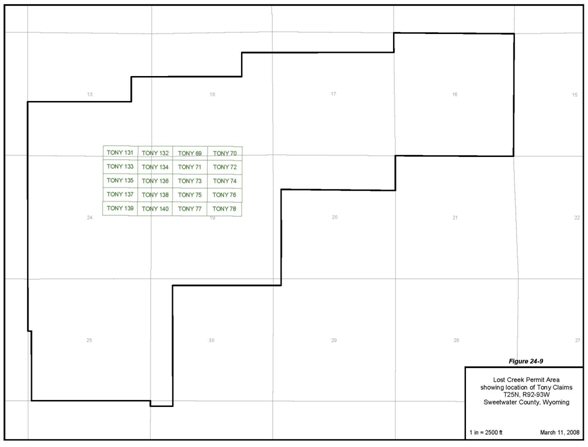
Figure 24‑9: Lost Creek Permit Area Showing location of Tony Claims T25N, R92-93W
|
53
|
|
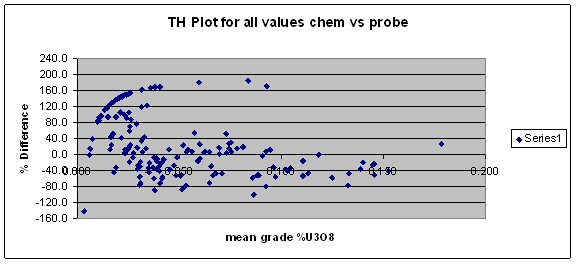
Figure 24‑10: Thompson -Howarth Plot Chemical Grade vs. Probe-2007 Drill Holes
|
54
|
|
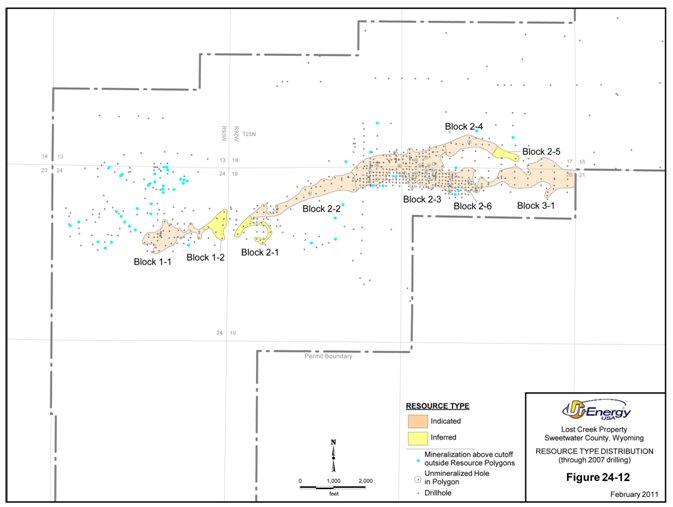
Figure 24‑12: Resource Type Distribution
|
56
|
Lyntek has generated a preliminary assessment or scoping study of the Lost Creek uranium in situ recovery (ISR) project located in Sweetwater County, Wyoming. Lost Creek ISR, LLC a wholly owned subsidiary of Ur-Energy USA Inc. controls the property and has evaluated the potential to place the property in production through the use of an in-house economic analysis. Lyntek has reviewed the analysis and has made changes as necessary to represent the project’s economics. During this effort, we reviewed several technical details regarding the project. This assessment was performed prior to March 20, 2008 and amended on February 25, 2011 to include additional drilling information between June 15, 2006 and March 20, 2008.
This report includes work conducted for an earlier NI 43-101 study that defined the uranium resources (C. Stewart Wallis, 2006) and an evaluation of the drilling conducted on the property through March 20, 2008. The Lost Creek resources based on a minimum grade of 0.03 percent U3O8 and a minimum grade thickness (GT) equal to or greater than 0.3 are reported in Table 1-1.
Table 1-1: Lost Creek Resources – April 2008
| |
|
Ur-Energy Inc. - Lost Creek Project
|
| |
|
|
|
|
|
Resource
Classification
|
Tons
Millions
|
Mineralized
Zone Average Thickness (Ft.)
|
Grade %U3O8
|
Pounds U3O8
Millions
|
|
Indicated
|
8.6
|
20.2
|
0.053
|
9.2
|
|
Inferred
|
0.5
|
11.4
|
0.066
|
0.7
|
Indicated Resources were defined by 200 feet to 100 foot spacing with the exception of a few sections drilled off at 50 feet spacing. Detailed drilling on closer spacing (up to 50 feet) will be necessary prior to the final engineering designs and the ISR mining of individual mine units during the life of the mine. Individual mine units will be drilled out with hydrologic testing just prior to mining each mine unit. Detail drilling of the first mine unit planned is not completed at this time. The size and shape of
individual mine units may vary when detailed drilling is carried out on each unit and the hydrologic characteristics of each mine unit may vary from mine unit to mine unit.
Since the practice of ISR mining is to drill out individual mine units just prior to mining each unit, this Preliminary Assessment report uses only the indicated mineral resources. A conservative approach to this preliminary assessment of the Lost Creek Project has been employed by using an in-place indicated resource of 7.6 million pounds of U3O8. Assuming an 80 percent uranium recovery, it is projected that there will be 6.1 million pounds of U3O8 produced. The uranium mineralization is primarily located in the HJ and the KM sandstone horizons at average depths of 435 feet and 555 feet, respectively.
Lost Creek ISR, LLC has conducted hydrologic studies through its contractor Petrotek Engineering Corporation (October 2007) of the mineralized HJ sandstone horizon. These studies show that the sandstones appear to have adequate hydrologic characteristics that will support ISR operations. In addition, it has been concluded that the shale layers above and below the HJ mineralized zone will act as adequate geologic members to contain the lixiviant within the desired production zone and prevent the migration of the lixiviant to water bearing geologic zones above and below the target mineralized zone.
It is important to note that there is an east-west scissor fault located down the axis of a significant portion of the resources. This fault will impact mining operations. The hydrology studies also defined the scissor fault as a tight zone which acts as a barrier to groundwater flow across the fault. In addition, there is a difference in ground water elevations within the HJ structure as the fault line is crossed. The water level on the south side of the fault lies below the water level on the north side of the fault. Work in evaluating the KM sandstone horizon has begun but needs to be finalized to determine if it has suitable characteristics consistent with the HJ horizon.
Leach studies have been conducted in 2005 and 2007. The leach studies conducted in 2005 used bottle roll tests on six one-foot core sections from five drill holes. The uranium grades within these six samples ranged from a low of 0.040 to a high of 0.480. With the application of 25 pore volumes of lixiviant containing 2 grams/liter HCO3 and 500 milligrams/liter of H2O2, the recoveries ranged from 59.4 to 92.8 percent. Interestingly, the high grade sample showed the lowest recovery and it is quite
possible that additional pore volumes of lixiviant would remove additional uranium as the last pore volume contained 68 milligrams of uranium, so recovery would likely improve to some degree on this high grade mineralized material. The next lowest recovery was 75.0 percent. The 2007 leach study focused on a homogenized production zone from one hole in the HJ horizon. The goal of this test group was to review a matrix of different chemistries in an effort to determine the most appropriate lixiviate chemistry for the project. Results of the tests show an elevated bicarbonate concentration may be required to maximize productivity at the Project. Natural groundwater with peroxide yielded a 20 percent ultimate recovery while all lixiviants with a bicarbonate concentration greater than 1.0 g/L averaged 88.6 percent ultimate recovery with a range of 84.1 to 93.3 percent.
Project economics have been developed assuming a 6000 gpm ISR processing plant producing one million pounds of U3O8 per year. During the first two years, yellowcake slurry will be produced while a dryer is being permitted and constructed so that afterwards dry yellowcake can be produced. The capital costs for plant equipment and facilities also include capital costs for a larger plant that will accommodate an additional one million pounds of U3O8 for processing resin from other properties including those belonging to Ur-Energy USA Inc. However the operating costs and sales of this additional yellowcake capacity have not been included in the economics analysis. It is assumed that the additional capital investment will present an un-quantified opportunity.
In Lyntek’s assessment of the economics for the project, we find that the project will produce results that are quite robust. The economic assessment assumes contingencies of 20 percent for both capital and operating costs. Lyntek has used a price forecast of $80 as an indicator of likely uranium prices in the future. Per Nuclear Market Review 1, this price is $15 below the current fixed price contract and $7 above the spot price indicator of February 29, 2008. Because of the volatility of uranium prices, this price appears to be a reasonable price upon which the project’s economics can be based. To allow for the volatility of the uranium price, we have assumed a price swing potential of $40 per pound of U3O8 and developed additional economic cases upon those swings to allow stakeholders to properly evaluate the potential economics of the project under possible price conditions. Because of the extreme difficulty in forecasting current uranium prices, it is recommended that stakeholders pay particular attention to the lower limit price forecast as a measure of evaluating risk for the project. In addition to assist with forecast issues, cost sensitivities were also modeled to evaluate potential cost variances. The results of these economic analyses are shown in Table 1-2.
|
Table 1-2: Economic Indicators
|
|
Case
|
Revenue ($MM)
|
Pre-tax IRR (%)
|
NPV @ 10%
($MM)
|
|
Case 1 Base Case U $80
|
486.4
|
42.9
|
100.7
|
|
Case 2 U $40
|
243.2
|
0.8
|
-29.4
|
|
Case 3 U $120
|
729.6
|
73.2
|
221.0
|
|
Case 4 U $80 Operating Costs +20%
|
486.4
|
38.2
|
84.7
|
|
Case 5 U $80 Operating Costs – 20%
|
486.4
|
47.3
|
112.6
|
|
Case 6 U $80 Capital Costs +20%
|
486.4
|
36.1
|
89.0
|
|
Case 7 U $80 Capital Costs -20%
|
486.4
|
51.8
|
112.4
|
|
Case 8 Worst Case U $40 Op. & Cap. Costs + 20%
|
243.2
|
-7.2
|
-51.1
|
|
Case 8 Best Case U $120 Op. & Cap. Costs - 20%
|
729.6
|
89.5
|
249.6
|
Based upon this economic assessment, it is recommended that work continue upon this project to further analyze the project, work to reduce risks, continue to permit and plan to execute the project as it appears to be worthwhile to continue these efforts. It is recommended that more extensive hydrologic and leach tests be conducted to better define these important considerations. Furthermore, there is no certainty that the results projected in the Preliminary Assessment will be realized and actual results may vary substantially.
This NI 43-101 report has been prepared by Lyntek, Inc. for Lost Creek ISR, LLC and Ur-Energy USA Inc. The purpose of this report is to independently confirm the in-house economic analysis of the Lost Creek Project located southwest of Bairoil, Wyoming, USA.
The information employed in this report is based upon Lyntek’s experience working in the global uranium sector, our experience working in the U.S. uranium sector, our experience working in Wyoming, information provided by Lost Creek ISR, LLC’s in-house report titled “Ur-Energy USA Inc. Lost Creek Project In-Situ Recovery Pre-Feasibility Study” dated January 2008.
The property was inspected by John I. Kyle on June 12th and 13th 2006 and February 18th and 19th, 2011. The property consists of mildly undulating semi-arid landscape covered by sagebrush and incised by local drainages. The area was accessed by good regional and local roads and drilling roads resulting from previous exploration efforts. The property is currently undeveloped but is covered by various drilling access roads. The site inspection included definition of US BLM cadastral survey markers, prior drilling sites, water wells, land form, general vegetative cover, power availability, access roads, natural gas pipelines and any other utilities in the region, physiographic features of the property, surface availability of construction materials on the site, other mining and processing operations in the region, visible wildlife, and local and regional towns. This investigation also considered potential locations to site the plant necessary for continued operations. The trip in 2011 was to confirm drilling sites of the 2007 drilling program as well as to inspect the core and related information.
|
3.0
|
RELIANCE ON OTHER EXPERTS
|
Lyntek reviewed the analytical and metallurgical work performed by Energy Laboratories, Inc. in Casper, Wyoming and is the opinion that this work complies with industry standards for the purposes of this report. The results of their work were presented in two reports:
A letter report to Harold Backer, dated May 15, 2005, with a title of “Uranium Leach Amenability Studies – Lost Creek Project”; and
A letter report to Ur-Energy USA, dated December 20, 2007, with a title of “Work Order C07101115 Lost Creek Project”.
Lyntek reviewed the report by Petrotek Engineering Corporation and is of the opinion the work is sutiable for the purposes of this report. The report is:
“Lost Creek Regional Hydrologic Testing Report – Lost Creek Project Sweetwater County, Wyoming”, dated October 2007.
|
4.0
|
PROPERTY DESCRIPTION AND ALLOCATION
|
(a) Property Location
The property description is included in a previous Technical Report titled “Technical Report on the Great Divide Basin Uranium Properties, Wyoming” authored by C. Stewart Wallis and dated June 15, 2005, as revised October 20, 2005. The report is available on SEDAR. Since the report was written, additional claim fractions have been staked and Ur-Energy USA Inc. has purchased NFU Wyoming, LLC the then owner of the Lost Creek property.
The Lost Creek Project presently consists of 201 unpatented lode claims and one state section lease totaling 4,220 acres. The property is located in Townships 25 North through Ranges 92 and 93 west of the Sixth Principal Meridian. The latitude is North 42 degrees eight minutes and West 107 degrees 51 minutes. The property is located 90 miles southwest of Casper and 38 miles north of Rawlins, Wyoming. Please see Figure 24-1 for the general location map and Figure 24-2 for the local vicinity map.
(b) Property Ownership
Between June 2005 and June 2007, Ur-Energy USA Inc. a Colorado corporation purchased 100 percent ownership of NFU Wyoming, LLC for US$20 million plus interest. NFU Wyoming, LLC owned several uranium properties in Wyoming and large databases from past exploration activities. Included in these properties was the Lost Creek property. In July 2007, NFU Wyoming, LLC a wholly owned subsidiary of Ur- Energy USA Inc. transferred the Lost Creek property to Lost Creek ISR, LLC, a wholly owned subsidiary of Ur-Energy USA Inc. for the specific purpose of permitting and developing the property for extraction of uranium using ISR techniques. The entire cost of acquiring the properties has been paid to the seller.
(c) Environmental Status
There have been no mining operations conducted on the property or on any immediately adjacent properties to date. Further south, the U.S. Nuclear Regulatory Commission’s licensed Sweetwater Mill still exists from mining which ended in 1982. The mill is a conventional type plant with ore produced for the mill by an open pit mine located near the plant. There are no impacts upon the Lost Creek site that result from the Sweetwater operations. Due to the fact that there have been no prior operations on the Lost Creek site, the only environmental impact to date has been from roads constructed on the surface and drill holes employed to define groundwater and mineral resources. There do not appear to be any environmental liabilities relative to the property.
(d) Permitting for Envisioned Mining Operations
In order to begin the process of mining for uranium, permits are required from local, state, and federal agencies. The primary permits required include the Nuclear Regulatory Commission (NRC) license, Wyoming Department of Environmental Quality (WDEQ) permit, WDEQ/EPA UIC permit, and a NPDES permit. Lost Creek ISR, LLC has contracted with AATA International, Inc. to develop the permits necessary to begin production at Lost Creek. AATA and Lost Creek ISR, LLC have been working steadily for over a year to prepare the necessary background information to allow the permits to proceed on a pace consistent with the plan for future production. The permits to the NRC and WDEQ were submitted in October and December of 2007.
One of the primary stumbling blocks to permitting the property for production of dried yellowcake is the timeframe required to permit a dryer. The time to permit a dryer, because of additional baseline air quality monitoring requirements, is about 1.5 years beyond that of the process to permit the remaining part of the operation. To deal with this issue, Lost Creek ISR, LLC has decided to permit the rest of the facility, ship the yellowcake slurry to an existing plant that has a dryer, and have that permitted facility dry the U3O8 slurry to a product that can be shipped to the refinery. This will allow production earlier while the dryer is being permitted.
It is estimated that a bond of $14,500,000 will be required before mining and reclamation have been completed. This cost has been included as a cash requirement beginning with one million during the first two years, $4.5 million in the third year, and $1.5 million during each of the next six years. The reclamation process will begin after each of the six mining units have been mined and is then expected to take about 5 years to complete after mining operations have finished.
|
5.0
|
ACCESSIBILITY, CLIMATE, LOCAL RESOURCES, INFRASTRUCTURE AND PHYSIOGRAPHY
|
The Lost Creek property is quite accessible. A paved road exists from Rawlins all the way to the Sweetwater Uranium Plant which is 3 miles south of the Lost Creek project. The area has rolling topography that is characterized by small ephemeral drainages and terrain dominated by sagebrush. Figure 24-3 provides a contour map of the area along with an outline of the property and the local roads. The vicinity is within the Red Desert and experiences winds throughout the year, snow in the winter months typically from October through late March. The temperatures and weather conditions are typical of the expectations one would expect in southwestern Wyoming.
The discovery of uranium deposits in the Permit Area and consequential exploratory drilling and studies have occurred over the course of four decades. In 1968, American Metals Climax Inc. acquired the property and discovered low-grade mineralization. Texasgulf, Inc., in 1976, optioned the property from Valley Development Inc., who later controlled the property, and exercised their option in 1979. Exploration drilling, carried out by Texasgulf from 1976 through 1982, identified the main mineral trend.
In 1969, Conoco Inc. (Conoco) acquired the adjacent property to the east and conducted a major exploratory drilling program, including installation of groundwater monitor wells. In 1978, Texasgulf optioned a 50 percent interest in Conoco’s property, and continued the exploratory drilling of the main mineral trend at Lost Creek to the east. In 1981, Texasgulf carried out laboratory column leach testing of core samples with carbonate lixiviant, which resulted in uranium extraction in excess of 89 percent. In 1982, Texasgulf conducted pump tests on the mineralized sandstones at Lost Creek. The hydrological characteristics of the mineralized sandstones indicated that uranium extraction could be conducted with ISR methods. In 1983, Texasgulf and Conoco discontinued their exploration activities and studies due to economic reasons.
In 1986, the Japanese-owned, PNC Exploration, USA acquired the lode claims in the Lost Creek property and carried out additional delineation drilling, geologic and resource studies of the deposit through 1992. New Frontiers Uranium, LLC purchased the property from PNC Exploration, USA in 2000. New Frontiers Uranium, LLC subsequently transferred the Lost Creek property along with its other Wyoming properties to NFU Wyoming, LLC.
From June 2005 through June 2007, Ur-Energy USA Inc., a Colorado corporation, purchased 100 percent ownership of NFU Wyoming, LLC. During that time, on the Lost Creek property, NFU Wyoming, LLC conducted engineering feasibility studies, core drilling for metallurgical studies, and delineation drilling to outline and define the uranium resources. In addition, NFU Wyoming, LLC conducted comprehensive baseline studies, including installation of additional monitor wells for hydrological testing and water-quality sampling and a meteorological station within the Lost Creek Property.
In July 2007, NFU Wyoming, LLC transferred its Lost Creek property to Lost Creek ISR, LLC, a wholly owned subsidiary of Ur-Energy USA Inc. formed for the specific purpose of owning and developing the permit area. Lost Creek ISR, LLC is currently proposing the extraction of uranium using ISR techniques on the Lost Creek property.
Details on the Geological Setting can be found in the Report referenced below and filed on Sedar:
Technical Report on the Great Divide Basin Uranium Properties, Wyoming
Prepared for Ur-Energy, Inc.
Report for NI 43-101
Author: C. Stewart Wallis, P. Geo
June 15, 2005, as revised October 20, 2005
Roscoe Postle Associates, Inc.
For reference, the geologic sequence is provided in Figure 24-4.
Details on the Geological Setting can be found in the Report referenced below and filed on Sedar:
Technical Report on the Great Divide Basin Uranium Properties, Wyoming
Prepared for Ur-Energy, Inc.
Report for NI 43-101
Author: C. Stewart Wallis, P. Geo
June 15, 2005, as revised October 20, 2005
Roscoe Postle Associates, Inc.
Figure 24-5 shows the current lateral extent of the mineralized material as defined with current drilling and Figure 4-6 shows the location of the primary location of the HJ sand with the mineralization there and also the location of the KM Sand further down the spectrum, which also has significant uranium resources.
URE commenced data compilation during 2005. The extensive database was digitized and all the geophysical logs were scanned. Historical drill hole locations, mineralized intervals, and grade were entered into a database. There has been no surface exploration by URE on the property other than the various environmental surveys. URE has conducted three drilling programs on the Property between 2005 and April 2008, as discussed in Item 11 Drilling.
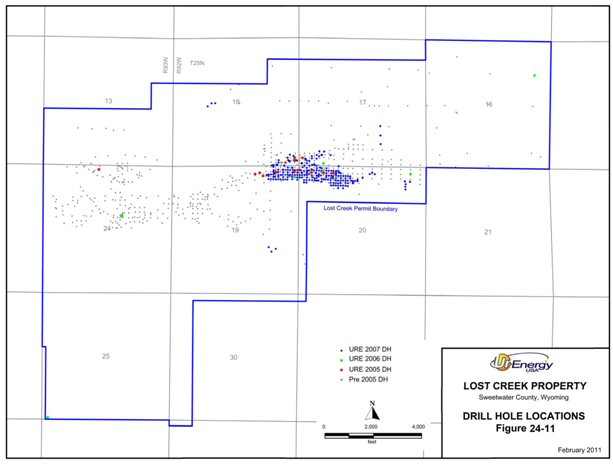
URE successfully completed 13 holes totalling 9,830 feet in October and November, 2005 (Figure 24-11). Twelve holes were located within 5 ft. to 10 ft. of the historical drill holes in order to verify mineralization intersected in those older holes and allow comparison of the mineralized intervals. One hole was located between two known holes to verify the continuity of mineralization between holes. Of the total footage, 472.3 ft. were cored using standard size core bits, producing core 3 in. in diameter.
During 2006, 17 holes were drilled for a total footage of 7,364 ft (Figure 24-11). These holes were cased for future use in pump tests and continuing use as monitor wells.
During 2007, 195 drill holes totalling 184,124 ft were completed as delineation holes. Of these 195 holes, four were partially cored for a total of 185.3 feet. In addition, two water wells and 58 additional monitor wells totalling 30,300 ft were completed.
As the stratigraphy has a very shallow dip, the sample intervals are considered to represent true thickness. The collars of all holes have been surveyed by a professional land surveyor using GPS. Drilling was carried out by an independent contractors, Taylor Drilling of Douglas, Wyoming, using a standard mobile rig capable of open-hole mud rotary and core drilling. The chips from the rotary holes were placed in plastic chip trays, logged on 5 ft. intervals, and photographed.
The intervals to be cored were determined by the mineralized intervals of the adjacent holes. The use of a 15 foot split-tube core barrel resulted in an average of 98.5% core recovery in 2005 and 93.8% in 2007. The core was taken from the split core tube, inserted in a plastic sleeve which was folded several times, stapled at both ends, put into a cardboard core box, and taken to the warehouse where it was logged in detail on a one-foot scale, photographed, checked with a hand held scintillometer, and marked for sampling. The 2007 core was logged and photographed on site before being vacuum sealed in plastic bags for shipment to the warehouse. Significant intercepts for the period 2005 to 2007 are listed in Table 11-1. These intervals include all mineralized intervals above a 0.03% U3O8 cut-off and are contained in the HJ sand and the underlying KM sand which are separated by 40 to 100 ft. The “other” designation indicates that the correlation is uncertain at this time and may belong to either horizon or an overlying or underlying stratigraphic unit. Additional infill drilling is required to delineate and correlate these mineralized units.
| |
Table 11-1: Significant HJ & KM Intercepts for the Period 2005-2007
|
| |
|
|
|
|
|
|
| |
HoleID
|
eThickness (ft.)
|
eGrade %eU3O8
|
eFrom (ft.)
|
eTo (ft.)
|
Stratigraphic Unit
|
| |
|
|
|
|
|
|
|
2005 DRILLING
|
|
|
|
|
|
| |
LC-2
|
8.5
|
0.034
|
375.5
|
385
|
HJ
|
| |
|
14
|
0.040
|
387.5
|
401.5
|
HJ
|
| |
LC-3
|
4.5
|
0.038
|
342.5
|
347
|
HJ
|
| |
|
4
|
0.074
|
385.5
|
389.5
|
HJ
|
| |
|
2
|
0.049
|
414
|
416
|
HJ
|
| |
LC-4
|
3.5
|
0.038
|
475
|
478.5
|
HJ
|
| |
|
9.5
|
0.050
|
485.5
|
495
|
HJ
|
| |
LC-6C
|
2.5
|
0.036
|
350
|
352.5
|
HJ
|
| |
|
11
|
0.071
|
400
|
411
|
HJ
|
| |
|
5
|
0.053
|
420
|
425
|
HJ
|
| |
|
11
|
0.044
|
432
|
443
|
HJ
|
| |
|
8
|
0.048
|
456
|
464
|
HJ
|
| |
LC-7C
|
17
|
0.044
|
377
|
394
|
HJ
|
| |
|
19.5
|
0.043
|
413
|
432.5
|
HJ
|
| |
LC-8C
|
8
|
0.132
|
405
|
412
|
HJ
|
| |
LC 9C
|
3.5
|
0.041
|
420
|
423.5
|
HJ
|
| |
|
3.5
|
0.037
|
426
|
429.5
|
HJ
|
| |
|
8
|
0.039
|
435
|
443
|
HJ
|
| |
|
6
|
0.037
|
445
|
451
|
HJ
|
| |
LC10C
|
14.5
|
0.082
|
414
|
428.5
|
HJ
|
| |
|
11
|
0.050
|
429
|
440
|
HJ
|
| |
|
12
|
0.050
|
448
|
460
|
HJ
|
| |
LC11C
|
19
|
0.053
|
431
|
450
|
HJ
|
| |
LC12C
|
3.5
|
0.031
|
430.5
|
434
|
HJ
|
| |
|
7
|
0.046
|
442
|
449
|
HJ
|
| |
LC-13C
|
7.2
|
0.051
|
408
|
416.2
|
HJ
|
| |
|
|
|
|
|
|
|
2006 DRILLING
|
|
|
|
|
|
|
| |
LC19M
|
22
|
0.074
|
413
|
435
|
HJ
|
| |
LC20M
|
1.5
|
0.360
|
338
|
339.5
|
Other
|
| |
LC20M
|
13
|
0.067
|
421
|
434
|
HJ
|
| |
LC20M
|
17
|
0.042
|
442
|
459
|
HJ
|
| |
LC22M
|
21
|
0.043
|
477
|
498
|
HJ
|
| |
LC26M
|
8
|
0.041
|
406
|
414
|
HJ
|
| |
|
|
|
|
|
|
|
2007 DRILLING
|
|
|
|
|
|
|
| |
LC102
|
3.5
|
0.108
|
446
|
449.5
|
HJ
|
| |
LC103
|
34.5
|
0.053
|
424
|
458.5
|
HJ
|
| |
LC104
|
25
|
0.045
|
445
|
470
|
HJ
|
| |
LC106
|
20.5
|
0.034
|
368
|
388.5
|
HJ
|
| |
LC109
|
24.5
|
0.047
|
428
|
452.5
|
HJ
|
| |
LC110
|
8.5
|
0.099
|
417
|
425.5
|
HJ
|
| |
LC110
|
13
|
0.031
|
482
|
495
|
HJ
|
| |
LC112
|
8
|
0.041
|
285.5
|
293.5
|
Other
|
| |
LC112
|
9.5
|
0.062
|
408.5
|
418
|
HJ
|
| |
LC113
|
8
|
0.051
|
439
|
447
|
HJ
|
| |
LC113
|
21.5
|
0.032
|
524
|
545.5
|
KM
|
| |
LC114
|
6.5
|
0.052
|
383
|
389.5
|
HJ
|
| |
LC114
|
10.5
|
0.078
|
421.5
|
432
|
HJ
|
| |
LC114
|
10
|
0.065
|
436
|
446
|
HJ
|
| |
LC115
|
9
|
0.063
|
420
|
429
|
HJ
|
| |
LC115
|
13
|
0.031
|
429.5
|
442.5
|
HJ
|
| |
LC116
|
30
|
0.049
|
421
|
451
|
HJ
|
| |
LC117
|
13.5
|
0.037
|
419.5
|
433
|
HJ
|
| |
LC120
|
35.5
|
0.049
|
523
|
558.5
|
KM
|
| |
LC121
|
19
|
0.031
|
531
|
550
|
KM
|
| |
LC122
|
10.5
|
0.073
|
379
|
389.5
|
HJ
|
| |
LC122
|
8.5
|
0.047
|
392
|
400.5
|
HJ
|
| |
LC122
|
33.5
|
0.053
|
419.5
|
453
|
HJ
|
| |
LC122
|
10.5
|
0.030
|
513.5
|
524
|
KM
|
| |
LC123
|
18.5
|
0.066
|
418
|
436.5
|
HJ
|
| |
LC123
|
12
|
0.029
|
441
|
453
|
HJ
|
| |
LC124
|
11.5
|
0.046
|
424
|
435.5
|
HJ
|
| |
LC125
|
11
|
0.030
|
401.5
|
412.5
|
HJ
|
| |
LC125
|
16
|
0.033
|
418.5
|
434.5
|
HJ
|
| |
LC126
|
12.5
|
0.026
|
424.5
|
437
|
HJ
|
| |
LC128
|
17.5
|
0.067
|
520.5
|
538
|
KM
|
| |
LC129
|
8.5
|
0.047
|
404.5
|
413
|
HJ
|
| |
LC130
|
13.5
|
0.030
|
424
|
437.5
|
HJ
|
| |
LC133
|
14
|
0.040
|
206
|
220
|
Other
|
| |
LC133
|
9
|
0.033
|
329.5
|
338.5
|
Other
|
| |
LC133
|
22
|
0.045
|
397.5
|
419.5
|
HJ
|
| |
LC133
|
10.5
|
0.030
|
466.5
|
477
|
HJ
|
| |
LC135
|
37.5
|
0.036
|
445
|
482.5
|
HJ
|
| |
LC136
|
18.5
|
0.042
|
406.5
|
425
|
HJ
|
| |
LC137
|
16.5
|
0.036
|
393.5
|
410
|
HJ
|
| |
LC137
|
17
|
0.028
|
442
|
459
|
HJ
|
| |
LC138
|
26
|
0.053
|
382.5
|
408.5
|
HJ
|
| |
LC140
|
18
|
0.032
|
393.5
|
411.5
|
HJ
|
| |
LC141
|
13.5
|
0.026
|
402
|
415.5
|
HJ
|
| |
LC143
|
13.5
|
0.030
|
485.5
|
499
|
HJ
|
| |
LC144
|
10.5
|
0.037
|
395.5
|
406
|
HJ
|
| |
LC150
|
12.5
|
0.032
|
385
|
397.5
|
HJ
|
| |
LC150
|
10.5
|
0.030
|
445
|
455.5
|
HJ
|
| |
LC158
|
11.5
|
0.046
|
402.5
|
414
|
HJ
|
| |
LC161
|
13
|
0.036
|
477
|
490
|
HJ
|
| |
LC162
|
8.5
|
0.036
|
465
|
473.5
|
HJ
|
| |
LC163
|
6
|
0.050
|
335.5
|
341.5
|
Other
|
| |
LC163
|
2.5
|
0.202
|
403.5
|
406
|
HJ
|
| |
LC163
|
10
|
0.055
|
425.5
|
435.5
|
HJ
|
| |
LC165
|
19.5
|
0.035
|
431
|
450.5
|
HJ
|
| |
LC168
|
16.5
|
0.035
|
386
|
402.5
|
HJ
|
| |
LC168
|
20
|
0.034
|
418.5
|
438.5
|
HJ
|
| |
LC169
|
11.5
|
0.098
|
562.5
|
574
|
KM
|
| |
LC169
|
8.5
|
0.041
|
513.5
|
522
|
HJ
|
| |
LC169
|
6
|
0.053
|
532
|
538
|
KM
|
| |
LC174
|
9
|
0.039
|
392
|
401
|
HJ
|
| |
LC177
|
48
|
0.040
|
397
|
445
|
HJ
|
| |
LC178
|
9.5
|
0.033
|
367
|
376.5
|
Other
|
| |
LC178
|
9
|
0.050
|
434
|
443
|
HJ
|
| |
LC181
|
11
|
0.028
|
462.5
|
473.5
|
HJ
|
| |
LC184
|
34
|
0.045
|
517
|
551
|
KM
|
| |
LC185
|
14
|
0.043
|
440.5
|
454.5
|
HJ
|
| |
LC185
|
8
|
0.048
|
503
|
511
|
HJ
|
| |
LC186
|
8
|
0.038
|
505
|
513
|
HJ
|
| |
LC186
|
19
|
0.049
|
409.5
|
428.5
|
HJ
|
| |
LC188
|
29
|
0.046
|
472
|
501
|
HJ
|
| |
LC188
|
23.5
|
0.049
|
518.5
|
542
|
KM
|
| |
LC189
|
9
|
0.040
|
476
|
485
|
HJ
|
| |
LC189
|
9
|
0.034
|
503
|
512
|
HJ
|
| |
LC189
|
16
|
0.028
|
551
|
567
|
KM
|
| |
LC193
|
19
|
0.039
|
401.5
|
420.5
|
HJ
|
| |
LC194
|
17.5
|
0.094
|
475
|
492.5
|
HJ
|
| |
LC194
|
10
|
0.059
|
493.5
|
503.5
|
HJ
|
| |
LC194
|
7.5
|
0.045
|
511.5
|
519
|
HJ
|
| |
LC195
|
7.5
|
0.063
|
526.5
|
534
|
HJ
|
| |
LC196
|
6.5
|
0.049
|
366
|
372.5
|
Other
|
| |
LC196
|
12.5
|
0.063
|
405
|
417.5
|
HJ
|
| |
LC197
|
15.5
|
0.029
|
443.5
|
459
|
HJ
|
| |
LC198
|
10.5
|
0.079
|
408.5
|
419
|
HJ
|
| |
LC198
|
10
|
0.044
|
429.5
|
439.5
|
HJ
|
| |
LC198
|
19
|
0.030
|
440.5
|
459.5
|
HJ
|
| |
LC199
|
6
|
0.077
|
395
|
401
|
HJ
|
| |
LC200
|
7.5
|
0.055
|
307
|
314.5
|
Other
|
| |
LC200
|
3
|
0.100
|
393.5
|
396.5
|
HJ
|
| |
LC201
|
8.5
|
0.051
|
324
|
332.5
|
Other
|
| |
LC202
|
22
|
0.073
|
398
|
420
|
HJ
|
| |
LC203
|
15.5
|
0.069
|
403.5
|
419
|
HJ
|
| |
LC204
|
14
|
0.049
|
403.5
|
417.5
|
HJ
|
| |
LC204
|
13
|
0.034
|
418.5
|
431.5
|
HJ
|
| |
LC205
|
26.5
|
0.054
|
372
|
398.5
|
HJ
|
| |
LC207
|
10
|
0.050
|
436.5
|
446.5
|
HJ
|
| |
LC209
|
9
|
0.034
|
484.5
|
493.5
|
HJ
|
| |
LC214
|
7.5
|
0.045
|
303
|
310.5
|
Other
|
| |
LC215
|
13
|
0.042
|
451
|
464
|
HJ
|
| |
LC215
|
12
|
0.056
|
406.5
|
418.5
|
HJ
|
| |
LC216
|
8
|
0.037
|
491
|
499
|
KM
|
| |
LC219
|
12
|
0.031
|
477
|
489
|
HJ
|
| |
LC219
|
8.5
|
0.038
|
518
|
526.5
|
KM
|
| |
LC220
|
10.5
|
0.051
|
125.5
|
136
|
Other
|
| |
LC222
|
4
|
0.091
|
139
|
143
|
Other
|
| |
LC222
|
10.5
|
0.030
|
426
|
436.5
|
HJ
|
| |
LC223
|
22
|
0.042
|
424
|
446
|
HJ
|
| |
LC224
|
5
|
0.115
|
424.5
|
429.5
|
HJ
|
| |
LC225
|
14.5
|
0.032
|
421
|
435.5
|
HJ
|
| |
LC227
|
7
|
0.050
|
382.5
|
389.5
|
HJ
|
| |
LC227
|
28
|
0.040
|
423
|
451
|
HJ
|
| |
LC228
|
9
|
0.036
|
136
|
145
|
Other
|
| |
LC33W
|
12
|
0.075
|
355.5
|
367.5
|
HJ
|
| |
LC35
|
14.5
|
0.036
|
500.5
|
515
|
HJ
|
| |
LC36
|
10.5
|
0.030
|
513
|
523.5
|
KM
|
| |
LC39
|
7
|
0.118
|
406
|
413
|
HJ
|
| |
LC40
|
11.5
|
0.034
|
522
|
533.5
|
KM
|
| |
LC41
|
14.5
|
0.028
|
497
|
511.5
|
KM
|
| |
LC43
|
7
|
0.079
|
335
|
342
|
Other
|
| |
LC43
|
16.5
|
0.027
|
498
|
514.5
|
KM
|
| |
LC45
|
27
|
0.121
|
386
|
413
|
HJ
|
| |
LC45
|
11.5
|
0.034
|
427
|
438.5
|
HJ
|
| |
LC46
|
16.5
|
0.021
|
478
|
494.5
|
KM
|
| |
LC46
|
25
|
0.050
|
500
|
525
|
KM
|
| |
LC47
|
22
|
0.049
|
439.5
|
461.5
|
HJ
|
| |
LC48
|
25.5
|
0.036
|
499
|
524.5
|
KM
|
| |
LC49
|
14.5
|
0.054
|
477.5
|
492
|
KM
|
| |
LC49
|
25
|
0.064
|
494.5
|
519.5
|
KM
|
| |
LC50
|
6.5
|
0.051
|
500
|
506.5
|
KM
|
| |
LC52
|
11.5
|
0.026
|
461
|
472.5
|
HJ
|
| |
LC53
|
13
|
0.027
|
419.5
|
432.5
|
HJ
|
| |
LC54
|
7
|
0.047
|
410.5
|
417.5
|
HJ
|
| |
LC54
|
7.5
|
0.041
|
419.5
|
427
|
HJ
|
| |
LC55
|
9
|
0.034
|
527.5
|
536.5
|
HJ
|
| |
LC57
|
10.5
|
0.044
|
266
|
276.5
|
Other
|
| |
LC57
|
5
|
0.114
|
488
|
493
|
KM
|
| |
LC59
|
9.5
|
0.040
|
532
|
541.5
|
HJ
|
| |
LC60
|
11.5
|
0.045
|
126
|
137.5
|
Other
|
| |
LC60
|
9
|
0.038
|
408
|
417
|
HJ
|
| |
LC60
|
8.5
|
0.061
|
434.5
|
443
|
HJ
|
| |
LC61
|
4
|
0.098
|
197
|
201
|
Other
|
| |
LC62
|
6.5
|
0.111
|
383
|
389.5
|
HJ
|
| |
LC62
|
6
|
0.098
|
412.5
|
418.5
|
HJ
|
| |
LC62
|
6
|
0.056
|
436.5
|
442.5
|
HJ
|
| |
LC62
|
11.5
|
0.035
|
453.5
|
465
|
HJ
|
| |
LC63C
|
20.5
|
0.032
|
409.5
|
430
|
HJ
|
| |
LC63C
|
13.5
|
0.033
|
431
|
444.5
|
HJ
|
| |
LC64C
|
15.5
|
0.057
|
497
|
512.5
|
KM
|
| |
LC65C
|
9
|
0.076
|
354.5
|
363.5
|
HJ
|
| |
LC65C
|
11
|
0.071
|
409.5
|
420.5
|
HJ
|
| |
LC66C
|
10.5
|
0.066
|
412
|
422.5
|
HJ
|
| |
LC66C
|
24.5
|
0.051
|
440.5
|
465
|
HJ
|
| |
LC67
|
7.5
|
0.050
|
498
|
505.5
|
KM
|
| |
LC68
|
9.5
|
0.047
|
322.5
|
332
|
Other
|
| |
LC68
|
9
|
0.040
|
410.5
|
419.5
|
HJ
|
| |
LC71
|
17
|
0.051
|
353
|
370
|
HJ
|
| |
LC73
|
21.5
|
0.033
|
203.5
|
225
|
Other
|
| |
LC74
|
22
|
0.032
|
327
|
349
|
Other
|
| |
LC74
|
11.5
|
0.059
|
405
|
416.5
|
HJ
|
| |
LC78
|
11.5
|
0.046
|
288
|
299.5
|
Other
|
| |
LC78
|
8.5
|
0.038
|
324.5
|
333
|
Other
|
| |
LC78
|
10
|
0.050
|
385
|
395
|
HJ
|
| |
LC79
|
6
|
0.089
|
319
|
325
|
Other
|
| |
LC79
|
8.5
|
0.138
|
419.5
|
428
|
HJ
|
| |
LC84
|
14
|
0.054
|
121
|
135
|
Other
|
| |
LC84
|
9
|
0.035
|
142
|
151
|
Other
|
| |
LC84
|
15
|
0.026
|
410
|
425
|
HJ
|
| |
LC86
|
16
|
0.032
|
369.5
|
385.5
|
HJ
|
| |
LC86
|
9.5
|
0.052
|
404.5
|
414
|
HJ
|
| |
LC88
|
10.5
|
0.034
|
201.5
|
212
|
Other
|
| |
LC88
|
14
|
0.024
|
452.5
|
466.5
|
HJ
|
| |
LC89
|
6.5
|
0.047
|
441
|
447.5
|
HJ
|
| |
LC90
|
28.5
|
0.050
|
421
|
449.5
|
HJ
|
| |
LC92
|
9
|
0.098
|
429
|
438
|
HJ
|
| |
LC92
|
14
|
0.045
|
502.5
|
516.5
|
Other
|
| |
LC93
|
16
|
0.032
|
465
|
481
|
HJ
|
| |
LC94
|
14.5
|
0.028
|
374.5
|
389
|
HJ
|
| |
LC94
|
11.5
|
0.056
|
418.5
|
430
|
HJ
|
| |
LC95
|
13.5
|
0.053
|
125.5
|
139
|
Other
|
| |
LC96
|
16.5
|
0.053
|
421.5
|
438
|
HJ
|
| |
LC96
|
13
|
0.027
|
485
|
498
|
HJ
|
| |
LC98
|
13.5
|
0.024
|
360
|
373.5
|
HJ
|
| |
LC99
|
3.5
|
0.109
|
208.5
|
212
|
Other
|
| |
LC99
|
12
|
0.045
|
434.5
|
446.5
|
HJ
|
| |
|
|
|
|
|
|
| |
HJMO-105
|
8.5
|
0.045
|
301
|
309.5
|
Other
|
| |
HJMP-101
|
8
|
0.040
|
419
|
427
|
HJ
|
| |
HJMP-105
|
8
|
0.040
|
306
|
314
|
Other
|
| |
HJMP-105
|
13
|
0.073
|
407
|
420
|
HJ
|
| |
HJMP-105
|
16
|
0.043
|
434.5
|
450.5
|
HJ
|
| |
HJMP-108
|
24.5
|
0.083
|
405
|
429.5
|
HJ
|
| |
HJMP-113
|
15.5
|
0.027
|
402.5
|
418
|
HJ
|
| |
HJMP-113
|
20
|
0.082
|
440
|
460
|
HJ
|
| |
HJMU-101
|
19.5
|
0.031
|
454
|
473.5
|
HJ
|
| |
HJMU-104
|
5.5
|
0.073
|
412
|
417.5
|
HJ
|
| |
HJMU-105
|
13
|
0.097
|
405.5
|
418.5
|
HJ
|
| |
HJMU-105
|
18
|
0.044
|
433.5
|
451.5
|
HJ
|
| |
HJMU-108
|
29
|
0.060
|
407.5
|
436.5
|
HJ
|
| |
HJMU-109
|
20
|
0.041
|
419.5
|
439.5
|
HJ
|
| |
HJMU-109
|
11.5
|
0.028
|
492
|
503.5
|
HJ
|
| |
HJMU-110
|
11.5
|
0.037
|
494
|
505.5
|
KM
|
| |
HJMU-113
|
14.5
|
0.023
|
404
|
418.5
|
HJ
|
| |
HJMU-113
|
23
|
0.057
|
440
|
463
|
HJ
|
| |
|
|
|
|
|
|
| |
HJT-101
|
12
|
0.035
|
427
|
439
|
HJ
|
| |
HJT-101
|
10.5
|
0.032
|
440.5
|
451
|
HJ
|
| |
HJT-101
|
9.5
|
0.041
|
452
|
461.5
|
HJ
|
| |
HJT-102
|
9.5
|
0.040
|
368.5
|
378
|
HJ
|
| |
HJT-105
|
4.5
|
0.120
|
457.5
|
462
|
HJ
|
| |
HJT-107A
|
4
|
0.130
|
157.5
|
161.5
|
Other
|
| |
|
|
|
|
|
|
| |
MO-107
|
3.5
|
0.101
|
292.5
|
296
|
Other
|
| |
|
|
|
|
|
|
| |
MP-102
|
13
|
0.028
|
426.5
|
439.5
|
HJ
|
| |
MP-102
|
11.5
|
0.033
|
444.5
|
456
|
HJ
|
| |
MP-103
|
13.5
|
0.042
|
386.5
|
400
|
HJ
|
| |
MP-104
|
18.5
|
0.035
|
424.5
|
443
|
HJ
|
| |
MP-104
|
12
|
0.038
|
444
|
456
|
HJ
|
| |
MP-105
|
33
|
0.046
|
394
|
427
|
HJ
|
| |
MP-106
|
11.5
|
0.075
|
409.5
|
421
|
HJ
|
| |
MP-106
|
22.5
|
0.048
|
438
|
460.5
|
HJ
|
| |
MP-107
|
11.5
|
0.083
|
353.5
|
365
|
HJ
|
| |
MP-107
|
10.5
|
0.126
|
410
|
420.5
|
HJ
|
| |
MP-108
|
6
|
0.091
|
413
|
419
|
HJ
|
| |
|
|
|
|
|
|
| |
MU-102
|
9.5
|
0.033
|
428.5
|
438
|
HJ
|
| |
MU-103
|
12.5
|
0.029
|
386.5
|
399
|
HJ
|
| |
MU-103
|
14
|
0.026
|
411.5
|
425.5
|
HJ
|
| |
MU-103
|
11.5
|
0.027
|
427.5
|
439
|
HJ
|
| |
MU-104
|
17.5
|
0.033
|
432
|
449.5
|
HJ
|
| |
MU-104
|
19.5
|
0.024
|
473.5
|
493
|
HJ
|
| |
MU-105
|
17
|
0.058
|
400
|
417
|
HJ
|
| |
MU-105
|
2
|
0.495
|
731
|
733
|
Other
|
| |
MU-106
|
17.5
|
0.070
|
403.5
|
421
|
HJ
|
| |
MU-106
|
25.5
|
0.040
|
432.5
|
458
|
HJ
|
| |
MU-107
|
8
|
0.067
|
358
|
366
|
HJ
|
| |
MU-108
|
8
|
0.039
|
425
|
433
|
HJ
|
| |
|
|
|
|
|
|
| |
UKMO-101
|
6.5
|
0.051
|
261
|
267.5
|
Other
|
| |
UKMO-102
|
11.5
|
0.049
|
266
|
277.5
|
Other
|
| |
UKMO-102
|
8.5
|
0.085
|
321.5
|
330
|
HJ
|
| |
UKMP-101
|
14
|
0.038
|
547.5
|
561.5
|
KM
|
| |
UKMP-102
|
10
|
0.045
|
272
|
282
|
Other
|
| |
UKMP-102
|
13.5
|
0.100
|
316
|
329.5
|
Other
|
| |
UKMP-102
|
11.5
|
0.032
|
486.5
|
498
|
KM
|
| |
UKMP-103
|
16
|
0.066
|
496.5
|
512.5
|
KM
|
| |
UKMU-103
|
8.5
|
0.035
|
463.5
|
472
|
HJ
|
| |
UKMU-103
|
13.5
|
0.045
|
496.5
|
510
|
KM
|
1 Nuclear Market Review, February 29, 2008, page 1
|
12.0
|
SAMPLING METHOD AND APPROACH
|
Each completed hole was surveyed using a down-hole probe by Century Geophysical Corp. (Century) of Tulsa, Oklahoma, an independent contractor that has carried out this type of work since the 1960s. Measurements taken by the down-hole probe included gamma logs, resistivity, self potential and hole deviation. In addition, some of the 2005 holes were run with a neutron log, which is often used to determine porosity; however, as results were found to mimic the resistivity, its use was discontinued. The gamma log measurements are recorded in one-tenth foot intervals down the hole and then combined and reported above selected cut-off limits in one-half foot intervals. A computer program converts the measured counts per second of the gamma rays into an equivalent percent U3O8 (eU3O8%).
For those holes that were cored, the core was scanned by a hand-held scintillometer to determine the sections to sample, and to confirm the intersections as determined by the down-hole gamma logs. The core was photographed, marked in one-foot intervals, and split in half with a hand chisel by URE employees. Selected intervals of core were taken for chemical assays and other physical measurements. Several one-quarter foot intervals of whole core were taken from various holes for porosity, and permeability tests, and not chemically assayed. In these cases, the assays were weight averaged over the total interval of mineralization. Sample length is approximately true thickness. Leach testing was conducted on half splits of the core which were composited per mineralized interval. In 2005, a total of 188 samples were bagged by employees of Energy Laboratories Inc. (Energy Labs) of Casper, Wyoming, and submitted for chemical analysis. In 2007 a total of 70 samples taken by URE employees were analyzed at Energy Labs.
|
13.0
|
SAMPLE PREPARATION, ANALYSES AND SECURITY
|
The core was delivered to Energy Labs and stored in a locked laboratory prior to and after sampling. Although not an ISO certified Lab, Energy Labs has been carrying out uranium analysis and test work since the 1970s and is considered qualified to carry out the work to industry standards. Energy Labs has an internal QA/QC system including inserting blanks, standards and duplicates into the sample stream which meets industry standards. In 2005 employees of Energy Labs bagged the split core for chemical and “closed can” analysis. Selected samples were also taken for porosity and permeability tests to be done by Maxim Technologies of Billings, Montana and leach tests to be completed at Energy Labs. In 2007, the samples were delivered to Energy Labs for chemical analysis only.
Samples for chemical and “closed can” gamma analysis are dried in a convection oven followed by grinding to -100 mesh. A 200 g sample is taken for the gamma analysis, placed in a tin and sealed with tape. A 15 day period is required to establish equilibrium between 226Ra and the daughter 214Bi. The principal behind “closed can” analysis is that in a particular mineralized body, 238U and 226Ra will be in equilibrium. Since 238U is the only source of 226Ra, one can assume that ideally, measuring the activity of 214Bi can be used to indirectly determine the total uranium concentration. Accuracy is determined by using certified 226Ra standards.
The chemical analysis uses a one-gram sample digested in a nitric acid-hydrogen peroxide mixture and measured by Inductively Coupled Argon Plasma (ICP) emission spectroscopy using certified standards for control.
In 2006, eleven duplicate samples were taken for duplicate assaying using fluorometric analysis at Hazen Research Inc. (Hazen). In addition two samples were sent to Assayers Canada in Vancouver for assay using acid digestion and ICP finish.
Stewart Wallis is of the opinion that the sampling and analysis has been carried out according to standard industry practices and is acceptable for use in resource estimates.
Data verification in 2005 (Wallis 2006) consisted of the following:
|
|
§
|
Comparison of the gamma logs for the URE holes and TG holes
|
|
|
§
|
Comparison of “closed can” eU3O8 grades with probe eU3O8 grades
|
|
|
§
|
Comparison of “closed can” grades with chemical grades
|
|
|
§
|
Comparison of gamma logs with chemical assays
|
|
|
§
|
Comparison of the Energy Labs chemical assays with Hazen and Canadian Assayers
|
Historic gamma logs were spot checked against the data base used for the project. In addition the 2005 core was observed at the warehouse and compared with the logs and assay analysis. Samples were sent to other labs for duplicate analysis (Wallis 2006).
A recent site visit by John Kyle P.E., one of the authors, was carried out on February 18, and 19, 2011. During the site visit numerous drill hole sites were observed and the location of 13 drill holes spread throughout the complete drilling program were verified in the field using a hand held GPS, and surveying equipment. Several drill hole clusters that had been drilled for mineralized zone and aquifer definition were observed along with many drill holes located on a grid equitable with definition drilling. The 2007 core, which was represented by four drill holes (L-63C, L-64C, L-65C, and L-66C) was observed and compared to the drill logs and assay sheets. In addition, a hand lens was used to evaluate the core. The assay sheets, evaluation of the core, and the drill logs were in compliance with each other and appeared to be quite appropriate.
Data verification for this report includes the comparison for 70 additional one foot chemical assays completed in 2007 by Energy Labs compared with the gamma logs on a ½ foot basis (Figure 24-10).
In a previous report (Wallis 2006) there was a suggestion that the geophysical derived grades are higher at lower grade values (less than 0.025 % U3O8), approximately the same between 0.025% and 0.04% U3O8, and lower for grades greater than 0.4% U3O8. Above a grade of 0.11% U3O8, the discrepancy can be as much as 150%. Geologically, the lower grades occur in the tails of the deposit whereas the higher grades occur within the nose of the roll front. The most recent data is similar in nature but there appears to be less variability as illustrated in the figure above.
This is not unexpected because sandstone uranium deposits are contained within actively flowing groundwater systems. The gamma probe indirectly measures the uranium content by measuring the gamma radiation of its daughter product, 214Bi. This element may be displaced from the original uranium or not yet completely
formed in equilibrium. This causes disequilibrium between uranium content as measured by the probe and as measured by chemical assay. Negative disequilibrium results if the uranium has been preferentially leached from the sandstone and positive disequilibrium results if the uranium is less than a million years old and the chemical grade is greater than the gamma equivalent grade. As the tails or back of the roll front are generally below cut-off, the average grade of the deposit as determined by the gamma logs may underestimate the total contained uranium in the deposit.
Although the data locally exhibit high variability, at the average grade of the deposit 0.05% to 0.06 % eU3O8 there does not appear to be a bias and the author is of the opinion that the eU3O8 values are appropriate for use in the resource estimate.
The area controlled by Ur-Energy USA Inc. ties up an area of known uranium mineralization that occurs within the region. There are additional mineralized areas to the south of Lost Creek that have been previously mined for uranium by Minerals Exploration Company (Union Oil of California) up to 1982. The property is known as the Sweetwater Mill and Mine and is now owned by Rio Tinto Americas, Inc. The facility is a conventional uranium mill and it has not operated since 1982. The main open pit operation was about 6 miles south of Ur-Energy’s uranium resources. To date, it is the most significant mining property within the vicinity. There are some properties claimed by others adjacent to the Lost Creek property, but most of the adjacent federal mining claims surrounding the Lost Creek property are owned by Ur-Energy’s subsidiary NFU Wyoming, LLC which controls 532 federal lode claims covering 10,900 acres adjacent to the Lost Creek property.
|
16.0
|
MINERAL PROCESSING AND METALLURGICAL TESTING
|
Metallurgical analyses were conducted by Dr. Honea in 1979 for Texasgulf through petrographic analysis upon two drill holes in the mineralized area. The mineralized material was reported by Dr. Honea to occur as extremely fine grains in the uranium silicate, coffinite, and the uranium oxide, uraninite. It occurs in the matrix of the arkoses, coating clastic grains or in voids between the grains, and is commonly associated with pyrite. Post-uranium deposition calcite is occasionally found and sometimes appears associated with the uranium.
Uranium is said to be in disequilibrium throughout the Lost Creek deposit. Results from R.F. Douglas, Ph.D, demonstrated a calculated disequilibrium factor of 1.23. Lost Creek ISR, LLC owns a Prompt Fission Neutron Tool that will be employed to directly measure U235 in the formation.
Mineral processing tests have been performed in the laboratory in 1979 by Texasgulf, in 2005 by Energy Laboratories, Inc., and most recently in the fall of 2007 by Energy Laboratories, Inc. of Casper, Wyoming. The leach test in 2005 employed 5 pore volumes in a bottle roll test with a lixiviant of 2 grams per liter of HCO3 and 500 milligrams per liter of H2O2. The leach tests demonstrated an average recovery of 82.8 percent, as shown in Table 16-1.
|
Table 16-1: Bottle Roll Leach Test Results – 2005
|
|
Drill Hole
|
Sample Interval Depth in Feet
|
Uranium Grade %
|
Recovery %
|
Last Pore Volume U Concentration mg/l
|
|
LC7C – 19
|
414 – 415
|
0.040
|
87.5
|
16.2
|
|
LC7C – 19
|
426 – 427
|
0.062
|
90.3
|
24.2
|
|
LC8C – 18
|
410 – 411
|
0.480
|
59.4
|
68.4
|
|
LC9C – 18
|
437 – 438
|
0.060
|
75.0
|
15.2
|
|
LC10C – 18
|
426 – 427
|
0.097
|
92.8
|
29.2
|
|
LC11C – 20
|
441 – 442
|
0.051
|
91.6
|
47.7
|
|
Average
|
|
0.132
|
82.8
|
33.5
|
It can be seen that the leach tests represent 1-foot increments within the mineralized zone. Therefore, these results represent specific intervals that were selected for the leach studies. The report is silent on the reasoning for the selection of these specific intervals and why these specific drill holes were selected. Because of this, no conclusions can be drawn regarding leaching of the entire mineralized zone at the location represented by the drill hole. It can be concluded, however that these discrete drill hole intervals do demonstrate the range of leaching characteristics shown above. The average recovery is calculated at 82.8 percent with a range of 59.4 to 92.8 percent.
It is interesting to note the high grade shown by drill hole LC8C-18 at 0.480 percent U3O8, which is about 10 times the grade typically observed in the deposit. Moreover, it can be seen that the recovery for this sample is rather low at 59.4 percent. It can be seen that the concentration of uranium recovered in the last pore volume was 68.4 milligrams per liter, so obviously additional pore volumes of lixiviant would continue to extract uranium and enhance the recovery estimate. The ultimate recovery, however, cannot be predicted. It can be seen that this principal applies to other samples that were leached. The conclusion is that the samples can be leached with a significant portion of the uranium, about 83 percent being leached from the mineralized samples in laboratory bench tests.
The test in 2007 had the objectives of analyzing several lixiviant combinations to provide information on uranium recovery relative to the various lixiviants. The work was performed upon Lost Creek ISR, LLC Core Hole LC-66C, using the 412 to 420.4 foot interval for compositing and leaching, with mineralized material grades determined by chemical and radiometric analysis. The moisture in the mineralized material was determined to be 8.53 percent and the metals content were as shown in Table 16-2. Dry bulk densities were assumed to be 2 grams per cubic centimeter and to have 30 percent porosity.
|
Table 16-2 Core Sample Metal Values
|
|
Metal
|
mg/kg
|
|
Arsenic
|
2.1
|
|
Molybdenum
|
ND (a)
|
|
Selenium
|
25.5
|
|
Sulfate
|
1,740
|
|
Sulfur
|
581
|
|
Uranium
|
513
|
|
Uranium, U3O8
|
605
|
|
Vanadium
|
7.6
|
|
(a) ND: Not Detectable
|
Seven bottle roll tests were conducted at ambient pressure and are not designed to approximate in-situ conditions, but are only intended to be indicative of the mineralized material’s reaction rate. Table 16-3 shows the following combination of lixiviants that were evaluated and are shown with the recovery results after 30 pore volumes, in 5 pore volume increments, of lixiviants were used. The variables in the lixiviants were bicarbonate concentration and oxidant strength using ambient groundwater, but with two tests conducted with laboratory grade water. The individual leach periods were 16 hours each.
|
Table 16-3: Bottle Roll Leach Test Results – 2007
|
|
Test #
|
Solution Base
|
Bicarbonate Concentration g/L
|
Peroxide Concentration g/L
|
Uranium Recovery % After 30 Pore Volumes
|
|
LC 2007-01
|
Ground Water
|
Natural
|
0.25
|
34.9
|
|
LC 2007-02
|
Ground Water
|
1,000
|
0.25
|
84.1
|
|
LC 2007-03
|
Ground Water
|
1,500
|
0.25
|
91.6
|
|
LC 2007-04
|
Ground Water
|
2,000
|
0.25
|
94.5
|
|
LC 2007-05
|
Ground Water
|
2,000
|
0.50
|
94.4
|
|
LC 2007-06
|
Synthetic H2O
|
2,000
|
0.25
|
95.7
|
|
LC 2007-07
|
Synthetic H2O
|
2,000
|
0.50
|
94.9
|
These results show that the core is leachable at the lixiviant concentrations shown above under ambient laboratory conditions. Respectable recoveries can be achieved with lixiviant concentrations greater than 1,500 g/L bicarbonate and 0.25 g/L peroxide.
In the opinion of Lyntek, the tests conducted to date demonstrate that the uranium can be leached in an in-situ environment and that bench scale tests demonstrate that a recovery in the range of 85% is quite possible. The range of lixiviant constituents were successfully chosen to adequately establish the lixiviant mixture for initial leaching operations. The mineralogical conclusions appear to be appropriate given hand lens examinations of the mineralized material. These tests have been conducted by laboratories with credible reputations within the industry and experience with uranium analyses. It is recommended that the tests be repeated and checked for veracity and that mineralogy tests be conducted upon the leach residue of the higher grade material that didn’t leach as well as the other samples leached
to assess whether there a reason as to why the uranium did not leach as well as the other samples and that additional samples be submitted for new mineralogical evaluation to determine if there are uranium minerals besides coffinite and uraninite that may not leach as well. The cost for these additional tests is probably about $10,000, but dependent upon deposit characteristics.
|
17.0
|
MINERAL RESOURCE AND MINERAL RESERVE ESTIMATES
|
Methodology
URE obtained an extensive database for the property which included the downhole geophysical logs for the historic drilling by Texasgulf. The drill holes from all previous drilling and the 2005-2007 URE drill programs were compiled in an Excel database. A total of 849 holes with 1,444 mineralized composites meeting a cut-off grade of 0.03 % U3O8 were identified within the current property boundary. The majority of the data consisted of U3O8 grade estimated from geophysical logs. Chemical assays were used where available, but they only represented approximately 4% of the intervals. Grade-thickness (GT) values were calculated for each hole, using a cut-off of 0.03% U3O8. All intercepts below the water table contributed to the total thickness. This includes mineralization hosted by two horizons, the HJ and KM as well as intervals where correlation is uncertain and could belong to either unit. A 0.3 GT boundary was used to create polygons, from which the area was calculated. There were 398 holes with 1,180 mineralized intervals ≥0.03 % U3O8 that met the required cut-off within the polygons as drawn. Nineteen (19) holes with a total GT value of less than 0.03 % U3O8 but within this boundary, were excluded from the estimate by creating a 50 ft radius around the hole and removing that area from the polygon.
The average of the thickness and GT values for a given polygon were derived using the holes contained within the polygon, and used in the calculation of volume, grade, and tons. Nine density measurements on the Lost Creek core returned tonnage factors from 14.8 cubic feet per ton (cft) to 17.1 cft with an average of 16.4 cft. Removing a possible shale sample results in an average of 16.6 cft. All previous resource estimates used a tonnage factor of 16 cft and the authors have elected to use 16.5 cft. There are 47 holes above cut-off that lie outside the resource polygons and were not included in the estimate. Further drilling is warranted to develop additional resources in these areas.
Stewart Wallis reviewed selected geophysical drill logs, compared the historic drill holes and geophysical logs with the twins drilled by URE and considers the data appropriate for use in a resource estimate.
A cut-off grade of 0.03% U3O8 and a GT product equal to or greater than 0.3 were used to define the mineral resources. This is based on a conservative uranium price of US$40 per pound and estimated operating costs of approximately US$20 per pound using an anticipated 80% recovery as discussed in Section 23. A higher price would allow the cut-off grade to be lowered, resulting in additional resources.
Classification of the resources was determined by a combination of grade continuity and drill hole spacing, nominally 100 ft to 200 ft. centres for indicated resources, with the exception of several section lines that have been drilled at 50 ft. spacing along the sections. Upgrading the resources to the measured category requires a detailed analysis of the stratigraphy and correlation of the mineralized intervals of the roll front. Also the author notes that the method of resource estimate used includes all intersections above the cut-off without regard to stratigraphy and will require additional interpretational drilling to develop mineable resources.
Stewart Wallis has reviewed the methodology used by URE and is of the opinion that the statement of mineral resources has been completed using accepted industry standards.
The current resources at the Lost Creek Project as at April 2, 2008, based on a minimum grade of 0.03% U3O8 and a GT equal to or greater than 0.3, are reported in Table 17-1. Stewart Wallis is of the opinion that the classification of resources as stated meets the CIM definitions as adopted by the CIM Council on December 11, 2006, as required by National Instrument 43-101 (NI 43-101).
Table 17-1: Lost Creek Resources – April 2008
| |
|
Ur-Energy Inc. - Lost Creek Project
|
| |
|
|
|
|
|
Resource
Classification
|
Tons
Millions
|
Mineralized
Zone Average Thickness (Ft.)
|
Grade %U3O8
|
Pounds U3O8
Millions
|
|
Indicated
|
8.6
|
20.2
|
0.053
|
9.2
|
|
Inferred
|
0.5
|
11.4
|
0.066
|
0.7
|
Compared to the 2006 resource estimate (Table 17-2) the indicated in-situ pounds have decreased by 6 % and the inferred in-situ pounds by 4%.
Table 17-2: Lost Creek Resources – 2006
| |
|
Ur-Energy Inc. - Lost Creek Project
|
| |
|
|
|
|
|
Resource
Classification
|
Tons
Millions
|
Mineralized
Zone Average Thickness (Ft.)
|
Grade %U3O8
|
Pounds U3O8
Millions
|
|
Indicated
|
8.5
|
19.5
|
0.058
|
9.8
|
|
Inferred
|
0.7
|
9.6
|
0.076
|
1.1
|
|
18.0
|
OTHER RELEVANT DATA AND INFORMATION
|
All pertinent information has been presented within the body of this report.
|
19.0
|
INTERPRETATION AND CONCLUSIONS
|
Based upon the work that has been accomplished, Lyntek concludes:
|
|
·
|
The uranium is leachable with a reasonable solution of bicarbonate and peroxide (and by extension, oxygen);
|
|
|
·
|
Overall recovery of uranium in the range of 85 percent appears reasonable; and
|
|
|
·
|
The capacity to employ in situ leaching has been demonstrated by hydraulic studies in the HJ zone.
|
The work that has been accomplished has met the general goals of the project. The leaching tests, for example, demonstrated that leaching with bicarbonate and peroxide will work and furthermore that specific combinations of lixiviants will produce specific results in bottle roll tests under laboratory conditions. Further tests are required to determine why some recovery rates are low as well as to ensure the leaching tests are applicable to the total resource. Hydraulic tests show that the HJ zone is amenable to in situ leaching, but tests are still necessary in the KM zone.
It is recommended that additional leach tests be conducted to represent the entire mineable vertical thickness while making sure that the leach tests represent the bulk of the resource. It is necessary to conduct this work upon the HJ and the KM zones.
Additional drilling is required to upgrade the resources to the measured category and to properly correlate the various mineralized horizons for future production.
The preliminary assessment economics of the project suggest robust economics that also suggest the project be advanced. It is widely believed that the supply and demand situation in the uranium sector will favor those who can place a uranium producer into operation as soon as possible. The analysis of the Lost Creek Project appears to provide economic conclusions that suggest this project should be furthered. It is recommended that a further study and investigations be implemented as soon as possible and that preparations to generate information which support further feasibility analysis be provided as soon as possible through efforts and studies to reduce risk while moving the project forward.
|
The following expenditures appear to be warranted:
|
|
|
Delineation drilling including geophysical logging (400 holes, 700 ft. @, $10/ft.)
|
$ 2.8 M |
|
Monitoring & Baseline Wells (50 wells, 500 ft. @, $25/ft.)
|
$ 0.625 M |
|
Deep Disposal Well Test hole: (10,000 ft.)
|
$ 2.5 M |
|
Geologists (6), Engineering (4) and Support Technical Staff (10)
|
$ 1.8 M/year |
|
Consultants for Baseline Environmental Studies, Hydrology Studies and Plant Design
|
$ 2.75 M |
|
U.S. Nuclear Regulatory Commission Permitting Fees -
|
$ 1.5 M |
| Additional Metallurgical Testing |
$0.01 M |
A letter report to Harold Backer, dated May 15, 2005, with a title of “Uranium Leach Amenability Studies – Lost Creek Project”; and
A letter report to Ur-Energy USA, dated December 20, 2007, with a title of “Work Order C07101115 Lost Creek Project”.
“Lost Creek Regional Hydrologic Testing Report – Lost Creek Project Sweetwater County, Wyoming”, dated October 2007. Report by Petrotek Engineering Corporation
“Technical Report on the Great Divide Basin Uranium Properties, Wyoming” authored by C. Stewart Wallis and dated June 15, 2005, as revised October 20, 2005.
“Technical Report on the Lost Creek Project, Wyoming Prepared for Ur-Energy, Inc. Report for NI 43-101 authored by Stewart Wallis, P. Geo. Roscoe Postle Associates, Inc. June 15, 2006
Geological Report on the Lost Creek Uranium Project. R.F. Douglas PhD, October 30, 2006.
Russell M. Honea, Consulting Geologist, 1105 Bellaire, Broomfield, Colorado 80020 – Two Personal Communications to Brian Hester of Texasgulf – June 25, 1979 and July 6, 1979
|
22.0
|
DATE AND SIGNATURE PAGE
|
This report titled “Amended NI-43-101 Preliminary Assessment for the Lost Creek Project Sweetwater County, Wyoming,” prepared for Ur-Energy and dated April 2, 2008 as amended February 25, 2011 was prepared and signed by the following authors:
Dated at Denver CO ____Signed and Sealed___
February 25, 2011 John I. Kyle PE
Dated at Vancouver BC ____Signed and Sealed____
February 25, 2011 C. Stewart Wallis P. Geo.
Dated at Denver CO ____Signed and Sealed___
February 25, 2011 Douglas K. Maxwell PE
CERTIFICATE OF QUALIFIED PERSON: C. Stewart Wallis
I, C. Stewart Wallis, P. Geo., as author of this report titled “NI 43-101 Amended Preliminary Assessment for the Lost Creek Project Sweetwater County, Wyoming,” prepared for Ur-Energy Inc. and dated April 2, 2008, as amended February 25, 2011, do hereby certify that:
|
1.
|
I am a consulting geologist and President of Sundance Geological Ltd. My office address is 1419 133A Street, Surrey, BC V4A 6A2.
|
|
2.
|
I am a graduate of McMaster University, Hamilton, Canada, in 1967 with a Bachelor of Science degree in Geology.
|
|
3.
|
I am registered as a Professional Geologist in the Province of British Columbia (Reg. # 372) and Saskatchewan (Reg. # 10829), a Professional Geologist in the State of Wyoming (Reg. # PG-2616) and a Certified Professional Geologist registered with the American Institute of Professional Geologists. I have worked as a geologist for a total of 40 years since my graduation.
|
|
4.
|
I have read the definition of "Qualified Person" set out in National Instrument 43-101 ("NI 43-101") and certify that by reason of my education, affiliation with a professional association (as defined in NI 43-101) and past relevant work experience on these types of deposits, I fulfill the requirements to be a "Qualified Person" for the purposes of NI 43-101.
|
|
5.
|
I visited the Lost Creek property May 9 - 14, 2005 and examined the core from the property on March 29, 2006. In the preparation of this amended report, I have communicated and coordinated with my co-author, John I. Kyle, who visited the property in 2006 and again in 2011.
|
|
6.
|
I am responsible for Sections 10 – 14, inclusive, and 17 of the Technical Report.
|
|
7.
|
I am independent of the Issuer applying the test set out in Section 1.4 of National Instrument 43-101.
|
|
8.
|
I have had prior involvement with the property in that I am the author of Technical Reports in 2005 and 2006 prepared for Ur-Energy and filed on SEDAR.
|
|
9.
|
I have read National Instrument 43-101, and the Technical Report has been prepared in compliance with National Instrument 43-101 and Form 43-101F1.
|
|
10.
|
To the best of my knowledge, information, and belief, as of the date of this certificate, the Technical Report contains all scientific and technical information that is required to be disclosed to make the technical report not misleading.
|
Dated February 25, 2011
Signed and Sealed “C. Stewart Wallis”
C. Stewart Wallis, P.Geo.
.
CERTIFICATE OF QUALIFIED PERSON: John I. Kyle
I, John I. Kyle, of Lyntek Inc., 1550 Dover Street, Lakewood, CO 80215, do hereby certify that:
|
1.
|
I graduated from the Colorado School of Mines with a Bachelor of Science Degree in Mining Engineering in 1974 and a Master’s degree in Business Administration in 1986 from Denver University.
|
|
2.
|
I am a Registered Professional Engineer in the State of Colorado. My registration number is 15882. I have been a member of the Society of Mining Engineers for over 20 years.
|
|
3.
|
I have worked in the mineral production industry for over 30 years. I have been a resident mine engineer, chief engineer, corporate mine planning engineer, mine design engineer, project manager, principal mining engineer, financial and budgeting director, and vice president as my career has progressed. I have been primarily employed by Peabody Coal Company, Mobil Coal Producing, Inc. Echo Bay Mines, Ltd., Pincock Allen & Holt, and Lyntek Inc.
|
|
4.
|
I am currently employed as Vice President of Lyntek Inc.
|
|
5.
|
I have read the definition of “qualified person” set out in National Instrument 43-101 (“NI 43-101”) and certify that by reason of my education, affiliation with a professional association (as defined in NI 43-101) and past relevant work experience, I fulfill the requirements to be a “qualified person” for the purposes of the NI 43-101.
|
|
6.
|
I am responsible for this report with the exceptions of Sections 10 – 14, and 17.
|
|
7.
|
I am independent of Ur Energy USA Inc. as described in section 1.4 of NI 43-101.
|
|
8.
|
I have visited the property June 12th and 13th, 2006 and again on February 18 and 19, 2011 for siting of the plant and confirmation of drilling programs. This is the only work I have expended for the project. I have overseen and reviewed the Ur- Energy capital and operating costs for the uranium production facility. For this certification, I have prepared and overseen the work and generation of the entire report.
|
|
9.
|
I have read NI 43-101 and the Technical Report has been prepared in compliance with NI 43-101.
|
|
10.
|
As of the date of this certificate, to the best of my knowledge, information and belief, the NI-43-101 Preliminary Assessment for the Lost Creek Project - Sweetwater County, Wyoming dated April 2, 2008 and amended February 25, 2011 contains all scientific and technical information that is required to be disclosed to make the Technical Report not misleading.
|
Dated the 25 of February 2011.
Signed and Sealed “John I Kyle P.E.”
John I Kyle P.E.
CERTIFICATE OF QUALIFIED PERSON: Douglas K. Maxwell
I, Doug K. Maxwell, of Lyntek Inc., 1550 Dover Street, Lakewood, CO 80215, do hereby certify that:
|
1.
|
I graduated from the Colorado School of Mines with a Bachelor of Science Degree in Metallurgical Engineering in 1979 and with a Masters of Engineering in Metallurgy in 1982. In both programs, I specialized in Mineral Processing and Extractive Metallurgy.
|
|
2.
|
I am a Registered Professional Engineer - Metallurgy in the State of Colorado. My registration number is 26758. I have been a member of the Extractive Metallurgy Chapter of Denver for 15 years and a member of the Society of Mining Engineers.
|
|
3.
|
I have worked in the mineral processing industry for over 20 years. I have been a project manager and process engineer for several projects at Lyntek. I have been a project manager and project engineer conducting laboratory and pilot plant process studies for BHP Minerals and International Process Research Company. I have been a project engineer and project manager conducting feasibility studies for mineral waste reprocessing for Camp Dresser & McKee and Dames & Moore. I have been an applications and field service engineer for mineral processing equipment for Ore Sorters North America and Dorr-Oliver.
|
|
4.
|
I am currently employed as Process Engineer by Lyntek Inc.
|
|
5.
|
I have read the definition of “qualified person” set out in National Instrument 43-101 (“NI 43-101”) and certify that by reason of my education, affiliation with a professional association (as defined in NI 43-101) and past relevant work experience, I fulfill the requirements to be a “qualified person” for the purposes of the NI 43-101.
|
|
6.
|
I am responsible for the mineral processing sections in Section 23.
|
|
7.
|
I am independent of Ur-Energy USA Inc. as described in section 1.4 of NI 43-101.
|
|
8.
|
I have not visited the property, but no plant exists at this point in time. I evaluated the Ur-Energy capital and operating cost for the uranium production plant. I have had no prior involvement in the property.
|
|
9.
|
I have read NI 43-101 and the Technical Report has been prepared in compliance with NI 43-101.
|
|
10.
|
As of the date of this certificate, to the best of my knowledge, information and belief, the NI-43-101 Preliminary Assessment for the Lost Creek Project - Sweetwater County, Wyoming dated April 2, 2008 and amended February 25, 2011contains all scientific and technical information that is required to be disclosed to make the Technical Report not misleading.
|
Dated the 25th of February 2011.
Signed and Sealed “Douglas K. Maxwell, P.E.”
Douglas K. Maxwell, P.E.
|
23.0
|
ADDITIONAL REQUIREMENTS FOR TECHNICAL REPORTS ON DEVELOPMENT PROPERTIES AND PRODUCTION PROPERTIES
|
(a) Mining Operations
The operating plan calls for the production of 1,000,000 pounds of uranium per year. Production was estimated to begin in the fourth quarter of 2009 with about 45,000 pounds being produced. Mining then continues through 2016 when 74,000 pounds are produced during the first quarter. The production and restoration schedule is provided in Figure 24-8. The mining operations envisioned to be employed are In Situ Recovery (ISR) methodologies which recover the uranium from the sandstone host rocks by leaching operations. When uranium mineralization is contained in a reduced environment in a sandstone host rock with good permeability and porosity and is below the water table, the uranium mineralization in the host rock may be amenable to ISR operations. A lixiviant is prepared which will oxidize the uranium contained in the host rock and pumped down to the uranium bearing zone where it flows to production wells positioned around the injection well. The flows of the lixiviant within the host sandstones are carefully controlled so that all of the lixiviant is managed to flow from the injection to the production wells. The uranium bearing lixiviant is then pumped out through the production wells to a processing plant where the uranium is recovered.
The uranium resources are within the HJ and the KM sandstone horizons. The HJ zone provides most of the uranium resources and is bounded on the top by the Lost Creek Shale, a 5 to 45 foot thick member, and on the bottom by the Sagebrush Shale. The Sagebrush Shale is 5 to 75 foot thick and is continuous throughout the mining area. The HJ zone is 100 to 160 foot thick with its surface situated 330 to 475 feet below ground surface. Hydrologic testing suggests both of the shale layers are good aquitards that will work well to control the lixiviant solutions to be employed. The Upper KM (UKM) zone lies below the Sagebrush Shale and is generally about 30 to 60 foot thick and lies about 500 to 600 feet below ground surface. Below the UKM is the No Name Shale, which is about 10 to 30 foot thick and continuous throughout the mining area.
(b) Mineral Processing
Mineral processing can be accomplished with a typical ISL processing facility, as shown in Figure 24-7. The plant is conceived to process 6,000 gallons per minute and produce 1 million pounds U3O8 per year from the uranium produced from the Lost Creek uranium resource. In addition, the plant will also be designed to allow the production of an additional 1 million pounds per year of U3O8 from tolling operations on the back side of the plant wherein deliveries can be taken from other production facilities in the region that need uranium resin processing and/or drying capacity. Dryers take about a year and a half longer to permit than a standard ISR plant. Therefore, the strategy by Lost Creek ISR, LLC is to prepare a yellowcake slurry that can be shipped to a licensed ISR plant that has the capacity to prepare a dried yellowcake product from the slurry that they receive. Discussions are ongoing with a current potential target, but these negotiations remain confidential at this point in time. Both of these strategies are sensible, but expanded drying capacity will depend on the timing and success of other potential producers coming on the market. First, the plan to ship the slurry can take advantage of the projected uranium price and secondly, the concept of adding additional capacity to toll process and package uranium may fill a need such as Lost Creek ISR, LLC currently has in the area. This concept can be further explored at a later stage in the project in more detail to ultimately make a decision on this issue, but at this point in time, it appears to be reasonable.
Uranium contained in the lixiviant extracted from the mineralized material will be pumped to the processing plant where it will first undergo ion exchange to load the uranium onto resin. It is assumed that using a Purolite resin will be successful. The resin has been successful in Kazakhstan and is now being tested in the US. This resin is at least 60 percent cheaper than the Dow resin and makes a substantial difference in the cost to purchase the resin. The loaded resin will then be stripped off the captured uranium through an elution process. The eluate is then subjected to precipitation and filtering processes. The filtering process generates a yellowcake slurry that then requires drying. This is the product that will be trucked to a licensed ISR plant that has excess drying, packaging, and storage capacity. It has been calculated that about 1-1/3 shipments per week will be necessary by approved and licensed haulers. After the uranium has been dried and packaged, the drums of yellowcake will be shipped directly to the refinery for ultimate processing.
The process will generate waste products. One waste, 11(e)(2) material will be generated and will be disposed of in a NRC licensed disposal facility. The primary waste disposal of liquids that have greater volumes are planned to be disposed in a disposal well. The primary injection target is the Lower Fort Union Formation which is approximately 1,000 to 1,500 feet thick in the southern portion of Lost Creek permit area. The Fort Union consists of fluvial sandstones with interbedded shales and clays.
Local data are limited, so geologic interpretations must be extrapolated over large distances. Based on regional data, the top of the Fort Union injection interval is projected to occur at about 9,200 feet BGS, while the base is about 11,000 ft BGS. Based on current drilling costs, completed well cost to the base of the Fort Union is expected to range from $2.0MM to $3.0MM. Because of the lack of testing data, the injection capacity of the Fort Union must be assessed from electric logs from offset wells. Those logs are encouraging with regard to sand development and indications of porosity (e.g., the logs show significant sand thickness and porosity). At this time, it is anticipated that two to three wells in the Fort Union would be required to meet Lost Creek ISR’s disposal requirements.
The Lance Formation occurs below the Lower Fort Union and does not appear to contain thick continuous sandstone sequences based on available well data. The Fox Hills occurs below the Lance, and is about 600 or more feet thick in the Lost Creek area; dependent upon water quality and reservoir characteristics, the Fox Hills may be a secondary target.
Another secondary target is the Upper Mesa Verde/Almond Formation which is projected to occur about 16,000 -17,000 ft BGS. Well penetration in the area typically terminates before fully penetrating the Mesa Verde Group, but available data suggest that there could be several hundred feet of sandstones at the top of the Mesa Verde deposited as marine or nearshore sandstones. Offset logs indicate that some of the Mesa Verde sands are relatively clean and have suitable porosity. However, no applicable DST data have been found to date. As such, the injection capacity of the Mesa Verde section is unknown.
To the north of Lost Creek, the Lower Lance and Mesa Verde sections are overpressured (e.g., approximately 11.5 to 12.0 ppg mud weight). If such pressure is encountered at Lost Creek, the viability of the Mesa Verde section for deep well injection will be reduced. Further, it is likely that intermediate casing would be required to test and/or complete the Mesa Verde section. Based on current drilling costs, completed well cost through the Almond (e.g., 17,000’) is expected to range from $3.0MM to $4.5MM.
Given the information that is available on this matter, it appears that a reasonable estimate on the cost per well at this point in time is $3.0 million. This study assumes that two wells will be required.
(c) Recoverability
Two sets of bottle roll leach tests have been conducted that indicate recoverability of uranium from the sandstone hosts. Definitive work has yet to be accomplished, but indications are that a recovery in the area of about 85 percent, inclusive of plant recovery are quite possible. Tests have been conducted on several 1 foot zones within several drill holes that represent the deposit, however, it is necessary to conduct further tests to better define the likely response of the mineralized material to the lixiviant that will introduced. Some work has been done to better define the makeup of the lixiviant, which will be helpful in moving forward to the production stage.
(d) Markets
The uranium markets are quite volatile having peaked in June of 2007 at $135 per pound of U3O8, while as of March 1, 2008, the spot price is $73 per pound. The demand for uranium has surpassed the supply for many reasons and now the imbalance is such that considerable attention has been placed upon production of uranium from global resources. For the economics for this analysis, Lyntek has elected to use a price between the spot price and the long term contract price as a current indicator of the price that could be employed for a long term uranium supply agreement. This price, $80 per pound, is as good an indicator of prices in the future as any forecast that is currently on the market. There is obviously a higher degree of price risk in the market at this point in time as is evidenced by the large swings in market price over a short period of time, so this is a concern for the economic analysis. In order to measure this risk, Lyntek has opted to use a price swing of $40 per pound, which dictates a low price of $40 per pound for the lower limit and a price of $120 for the higher price limit.
There are no contracts in place at this point in time for the Lost Creek property for product sales, tolling agreements, or other arrangements relative to the production of a final uranium product.
(e) Environmental Considerations
A complete review of the environmental aspects of the project can be found in the report by AATA International Inc. (AATA) (2005) Environmental and Social Due Diligence Report, Great Divide Basin ISL Uranium Project, which is available on SEDAR. Ur-Energy submitted an Application for a Source Materials License for the Lost Creek Project to the US Nuclear Regulatory Commission (NRC) on October 30, 2007 and then an Application for a License to Mine to the Wyoming Department of Environmental Quality (WDEQ) on December 20, 2007. The various permit applications can be found at the NRC ADAMS database www.nrc.gov/reading-rm/adams.html.
There have been numerous permitting surveys completed to date; including meteorology, noise, socio-economic, ground radiation, water quality, botanical, historical, cultural, biology among others. Based on the various reports there are no environmental circumstances that will prohibit the development of a mine.
(f) Taxes and Royalties
Primary taxes are comprised of property taxes, which are estimated to be about $200,000 per year, severance taxes, which are 1.7 percent of revenue, and ad valorem taxes, which are 3.2 percent of revenue.
Of the 201 federal lode claims at Lost Creek only 20 lode claims (Tony Claims) have an outstanding royalty. The Tony Claims are shown in Figure 24-9. This royalty is a 1/3 interest of 5 percent yellowcake sales or 1.67 percent. The Tony claims originally had three individuals sharing a 5 percent royalty as of 1987. They were Robert Nunn, G.T. Sims and Richard Fruchey. Richard Fruchey was one of the three individuals that owned New Frontiers Uranium, LLC and his Lost Creek property was one of the New Frontiers Uranium’s properties transferred to NFU Wyoming, LLC. In 1998, Fruchey obtained G.T. Sim’s 1/3 share of the 5 percent royalty. When NFU Wyoming, LLC was purchased by Ur-Energy USA Inc. Fruchey included his 2/3 of 5 percent royalty in the sale. This left only Robert Nunn, with his 1/3 share (1.67 percent), as holding any royalties on the 20 Tony claims.
Part of the uranium resources crosses the Tony claims. To date, the Tony claims have not been drilled out in detail, so at this point of the resource production planning, the best guess of a royalty payment period is that there will be up to three years production in this area and that the Tony claims will not be mined in the first two or three years.
(g) Capital and Operating Costs
The capital costs have been calculated for the complete facility to place the processing plant into production with a total capacity of one million pounds for the front-end of the plant and an additional one million pounds for the back–end of the plant. The total infrastructure cost to initial production is approximately $35.7 million and estimated to be $41.7 million with a 20 percent contingency. For the life of the mine, total capital costs for the project are forecast to range from $76 million without contingency to $90 million with 20 percent contingency or $11.80 per pound without contingency to $14.00 per pound of U3O8 with 20 percent contingency. Operating costs are forecast to range between $12 and $26 million during the years when full production is experienced. The average cost is projected to range from $18.81 per pound without contingency to $22.57 per pound of U3O8 produced with 20 percent contingency. Table 23-1 provides a summary of the economic analysis.