Exhibit 99.1
Preliminary Assessment
Lost Creek Property
Sweetwater County, Wyoming
Ur-Energy Inc.
Prepared for:
Ur-Energy Inc.
10758 W. Centennial Rd, Suite 200
Littleton, CO 80127 USA
|
Prepared by:
|
|
| |
|
|
Douglass H. Graves, P.E
|
Robert D. Maxwell, CPG
|
|
Matthew J. Yovich, P.E.
|
|
| |
|
|
TREC, Inc. Inc.
|
Behre Dolbear & Company (USA),
|
|
951 Werner Court, Suite 395
|
999 Eighteenth Street, Suite 1500
|
|
Casper, Wyoming 82601
|
Denver, Colorado, USA.
|
| |
|
|
March 16, 2011
|
|
Preliminary Assessment
Lost Creek Property
Sweetwater County, Wyoming
Ur-Energy Inc.
TABLE OF CONTENTS
|
1.0 Title Page Preliminary Assessment
|
1
|
|
TABLE OF CONTENTS
|
2
|
|
List of Tables
|
6
|
|
Preliminary Assessment
|
7
|
|
3.0 Summary
|
7
|
|
4.0 Introduction
|
19
|
|
4.1 Report Preparation
|
19
|
|
4.2 Purpose and Project Description
|
19
|
|
4.3 Terms of Reference
|
20
|
|
4.4 Sources of Information
|
20
|
|
4.5 Site Visits
|
21
|
|
5.0 Reliance on Other Experts
|
21
|
|
6.0 Property Description and Location
|
21
|
|
6.1 Location and Size
|
21
|
|
6.2 Mining Claims, Mineral Leases and Surface Use Agreements
|
21
|
|
6.3 Title to Property
|
22
|
|
6.4 Property Boundaries
|
22
|
|
6.5 Mineralized Areas, Surface Disturbance and Existing Mine Workings
|
22
|
|
6.6 Royalties, Taxes and Fees
|
22
|
|
6.7 Environmental Liabilities
|
23
|
|
6.7.1 Residual Liabilities
|
23
|
|
6.7.2 Environmental Management and Regulation
|
23
|
|
6.8 Permits Required to Conduct Work
|
23
|
|
7.0 Accessibility, Climate, Local Resources, Infrastructure and Physiography
|
26
|
|
7.1 Topography, Elevation and Vegetation
|
26
|
|
7.2 Access
|
26
|
|
7.3 Proximity to Population Centers and Transport
|
27
|
|
7.4 Climate and Operating Season
|
27
|
|
7.5 Local Resources and Property Infrastructure
|
28
|
|
7.6 Hydrogeology/Water Supply
|
29
|
|
7.7 Background Radiological Characteristics
|
31
|
|
7.8 Other Environmental Investigations
|
32
|
|
8.0 History
|
32
|
|
8.1 Ownership History of the Lost Creek Property
|
32
|
|
8.2 Exploration and Development Work Undertaken
|
33
|
|
8.3 Historic Mineral Resource Estimates and Their Reliability
|
34
|
|
8.4 Production History
|
36
|
Preliminary Assessment, Lost Creek Property
|
9.0 Geological Setting
|
37
|
|
9.1 Regional, Local, and Property Geology
|
37
|
|
9.2 Hydrogeology
|
38
|
|
10.0 Deposit Types
|
38
|
|
11.0 Mineralization
|
39
|
|
12.0 Exploration
|
43
|
|
12.1 Lost Creek Project
|
43
|
|
12.2 Adjoining Properties
|
43
|
|
13.0 Drilling
|
44
|
|
14.0 Sampling Method and Approach
|
46
|
|
15.0 Sample Preparation, Analyses and Security
|
48
|
|
16.0 Data Verification
|
48
|
|
17.0 Adjacent Properties
|
48
|
|
18.0 Mineral Processing and Metallurgical Testing
|
49
|
|
19.0 Mineral Resource Estimates
|
52
|
|
19.1 Resource Classification
|
53
|
|
19.2 Cutoff Selection
|
53
|
|
19.3 Assumptions and Methodology
|
54
|
|
19.3.1 Assumptions
|
54
|
|
19.3.2 Methodology
|
54
|
|
19.4 Summary of Mineral Resources
|
55
|
|
20.0 Other Relevant Data and Information
|
57
|
|
20.1 Radiometric Equilibrium
|
57
|
|
20.2 Resource Estimation by Polygonal Method
|
58
|
|
21.0 Additional Requirements for Technical Reports
|
59
|
|
21.1 Wellfields
|
59
|
|
21.1.1 Proposed Wellfield Design
|
60
|
|
21.1.2 Wellfield Installation
|
60
|
|
21.1.3 Mechanical Integrity Testing (MIT)
|
61
|
|
21.1.4 Production
|
61
|
|
21.1.5 Development Plan
|
61
|
|
21.1.6 Piping System
|
62
|
|
21.1.7 Header Houses
|
63
|
|
21.1.8 Wellfield Reagents, Electricity and Propane
|
63
|
|
21.2 Processing
|
64
|
|
21.2.1 Plant Reagents, Electricity and Propane
|
66
|
|
21.2.2 Liquid Disposal (Deep Disposal Well)
|
67
|
|
21.2.3 Solid Waste Disposal
|
67
|
|
21.3 Site Human Resources
|
68
|
|
21.4 Taxes, Rents and Royalties
|
68
|
|
21.5 Capital Cost Estimation (CAPEX)
|
69
|
|
21.5.1 Wellfields
|
71
|
|
21.5.2 Processing Plant
|
72
|
|
21.5.3 Process Plant Piping
|
73
|
|
21.5.4 Earthwork and Topsoil Management
|
73
|
|
21.5.5 Concrete
|
73
|
Preliminary Assessment, Lost Creek Property
|
21.5.6 Structural Steelwork
|
73
|
|
21.5.7 Electrical and Instrumentation
|
73
|
|
21.5.8 Infrastructure and Facilities
|
74
|
|
21.5.9 EPCM and Expenses
|
76
|
|
21.5.10 Contingency
|
76
|
|
21.5.11 Owner’s Costs
|
76
|
|
21.6 Operating Cost Estimation (OPEX)
|
76
|
|
21.6.1 OPEX Allocation and Methodology
|
76
|
|
21.6.2 Salaries and Wages
|
78
|
|
21.6.3 Consultants
|
78
|
|
21.6.4 Office, Site and Administrative Costs
|
79
|
|
21.6.5 Insurance
|
79
|
|
21.6.6 Taxes, Leases, Fees and Royalties
|
79
|
|
21.6.7 Wellfield Operating Costs
|
79
|
|
21.6.8 Process Plant Reagents
|
80
|
|
21.6.9 Process Plant Maintenance
|
80
|
|
21.6.10 Plant Power
|
80
|
|
21.6.11 Access Road Maintenance
|
80
|
|
21.6.12 Product Freight
|
80
|
|
21.6.13 Waste Disposal
|
80
|
|
21.7 Closure
|
81
|
|
21.7.1 Well Abandonment/Aquifer Restoration
|
81
|
|
21.7.2 Demolition and Removal of Infrastructure
|
81
|
|
21.7.3 Site Grading and Re-vegetation
|
81
|
|
21.7.4 Closure Costs
|
81
|
|
21.8 Mine Life
|
82
|
|
21.9 Economic Analysis
|
82
|
|
21.9.1 Capital and Operating Costs
|
86
|
|
21.9.2 Taxation
|
87
|
|
21.10 Project Implementation and Execution Plan
|
87
|
|
21.11 Risk Assessment
|
87
|
|
21.11.1 Uranium Recovery and Processing
|
87
|
|
21.11.2 Delays in Obtaining Licenses/Permits and Approvals
|
88
|
|
21.11.3 Market and Contracts
|
88
|
|
21.11.4 Resources
|
89
|
|
21.11.5 Sage Grouse
|
90
|
|
21.11.6 Deep Disposal Wells
|
90
|
|
21.11.7 Radiological Waste
|
91
|
|
21.11.8 Radiological
|
91
|
|
21.11.9 Political
|
91
|
|
21.11.10 Transport
|
91
|
|
21.11.11 Fire Protection
|
92
|
|
21.11.12 Reagent Storage
|
92
|
|
21.11.13 Chemical Spills
|
93
|
|
21.11.14 Occupational Health and Safety
|
93
|
|
22.0 Interpretation and Conclusions
|
93
|
Preliminary Assessment, Lost Creek Property
|
23.0 Recommendations
|
94
|
|
24.0 References
|
95
|
|
25.0 Date and Signature Page and Certification
|
97
|
|
26.0 Illustrations
|
100
|
List of Illustrations
Figures are located in Section 26, except embedded figures as noted below.
|
Section 3.0
|
|
|
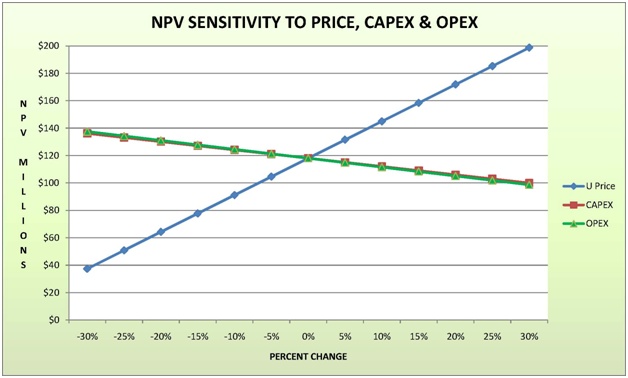
Figure S-1: NPV Sensitivity to Price, CAPEX and OPEX
|
Embedded in Text pg. 16
|
|
Figure S-2: NPV vs. Percent of Resources Recovered
|
Embedded in Text pg. 17
|
| |
|
|
Sections 4.0 through 23.0
|
|
|
Figure 1: General Location Map
|
|
|
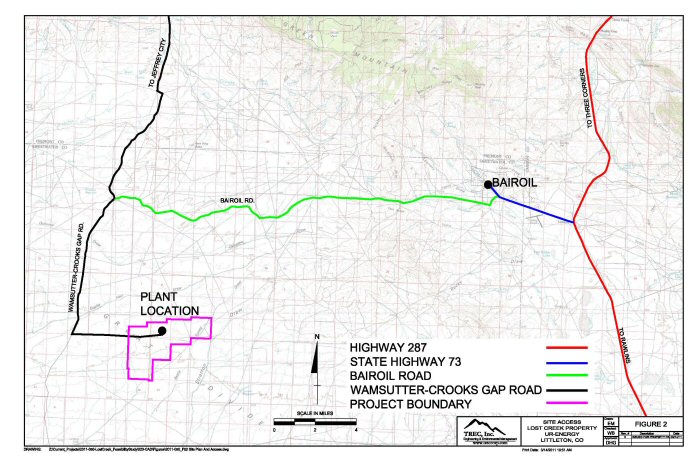
Figure 2: Site Access
|
|
|
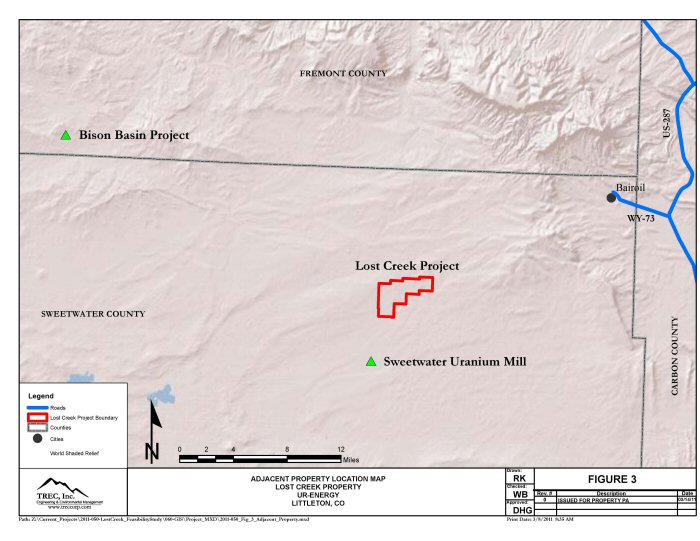
Figure 3: Adjacent Property Location Map
|
|
|
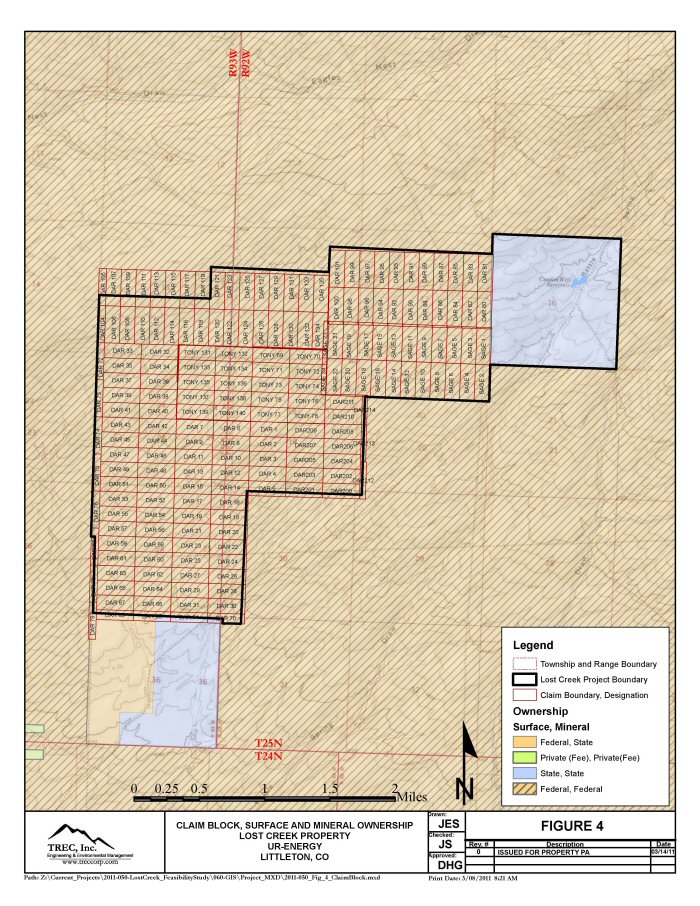
Figure 4: Claim Block, Surface and Mineral Ownership
|
|
|
Figure 5: Adjoining Properties
|
|
|
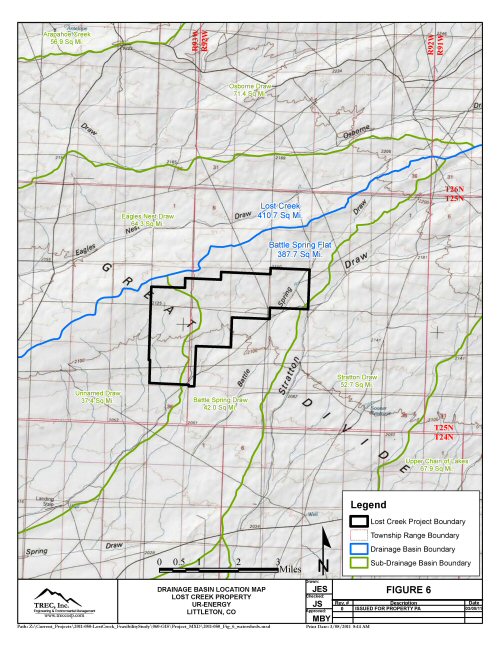
Figure 6: Drainage Basin Location Map
|
|
|
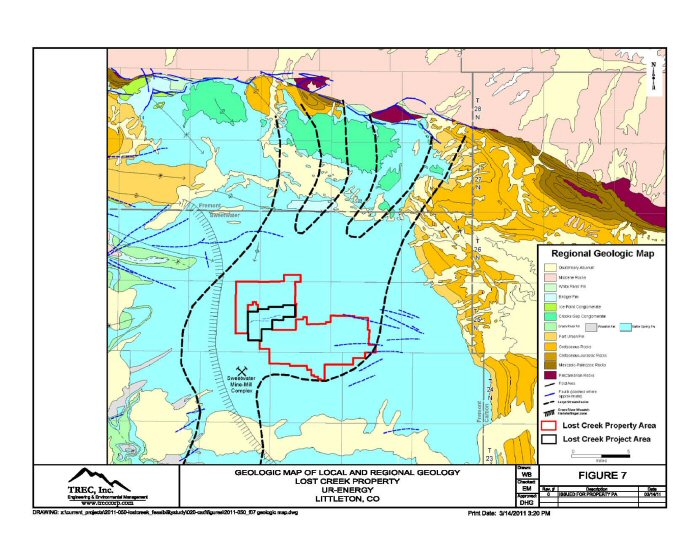
Figure 7: Geologic Map of Local and Regional Geology
|
|
|
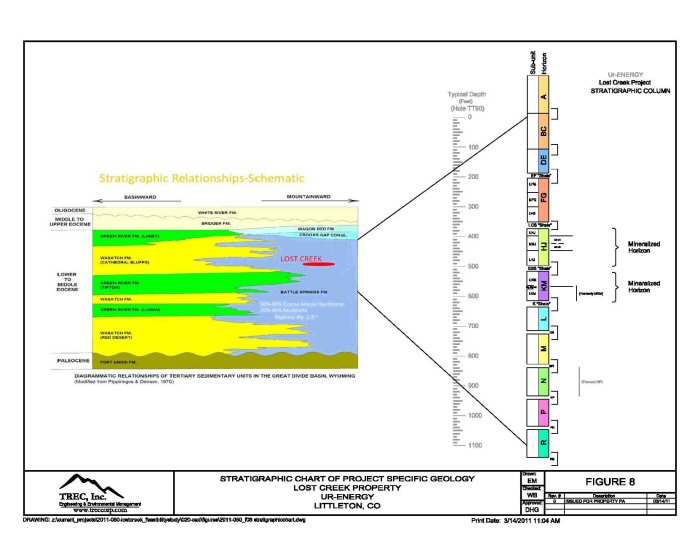
Figure 8: Stratigraphic Chart of Project Specific Geology
|
|
|
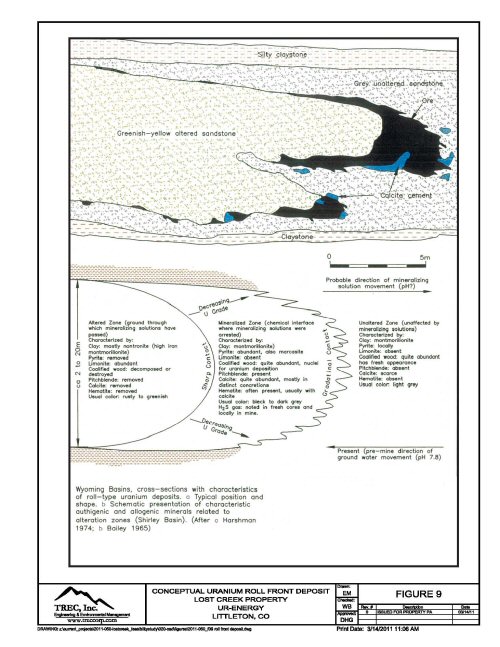
Figure 9: Conceptual Uranium Roll Front Deposit
|
|
|
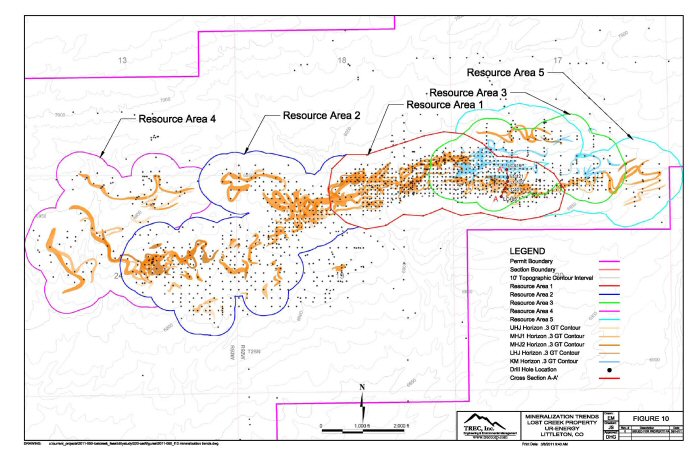
Figure 10: Mineralization Trends
|
|
|
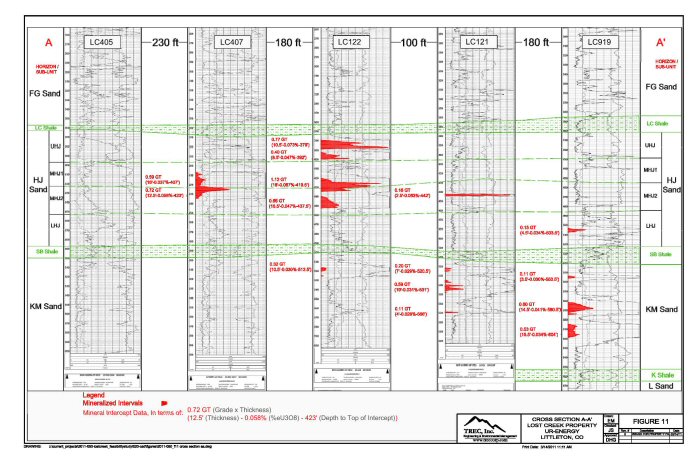
Figure 11: Cross Section A-A’
|
|
|
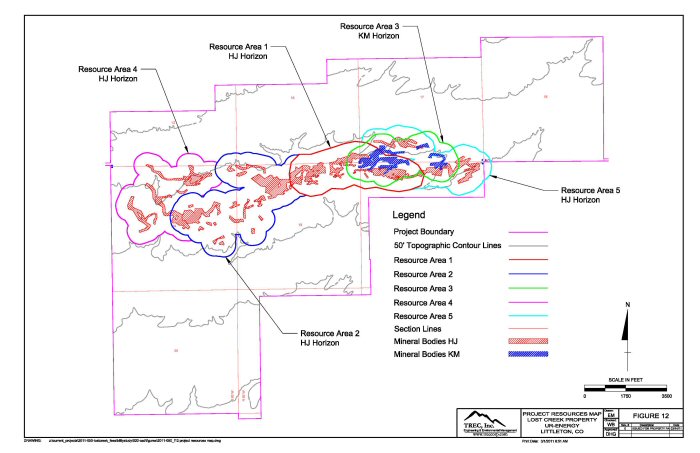
Figure 12: Project Resources Map
|
|
|
Figure 13a: Injection Well Detail
|
|
|
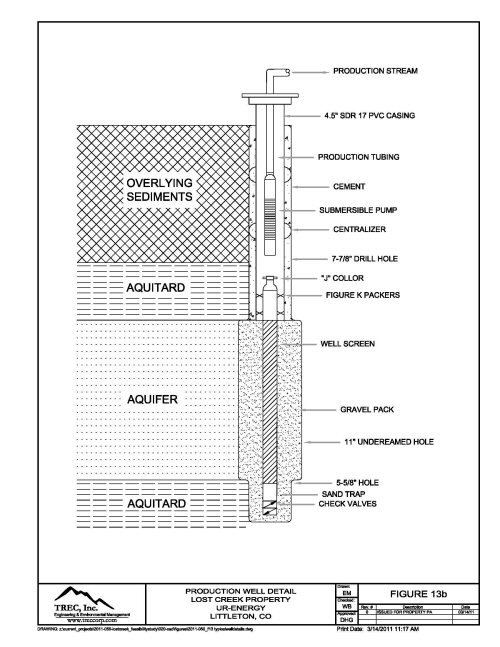
Figure 13b: Production Well Detail
|
|
|
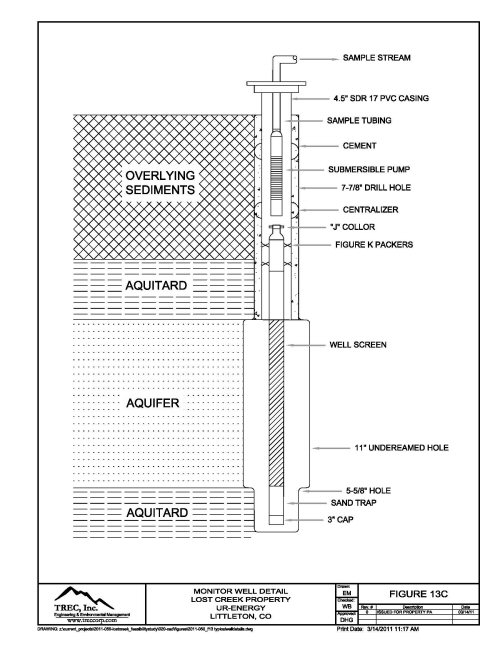
Figure 13c: Monitor Well Detail
|
|
|
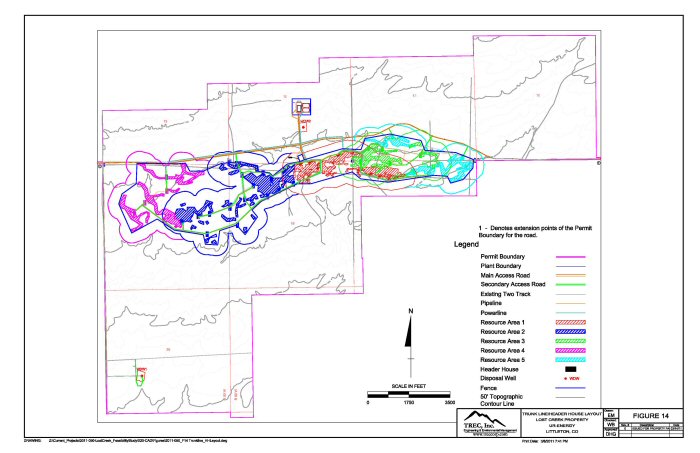
Figure 14: Trunk Line/Header House Layout
|
|
|
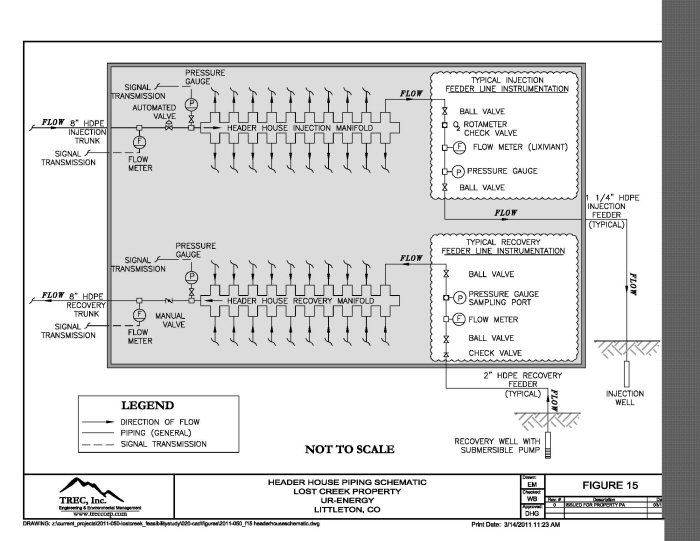
Figure 15: Header House Piping Schematic
|
|
|
Figure 16: Plant Flow Diagram
|
Embedded in Text pg. 65
|
|
Figure 17: Processing Plant Layout
|
|
|
Figure 18: Construction, Production, Restoration and Reclamation Schedule
|
Embedded in Text pg. 83 |
|
Figure 19: NPV Sensitivity to Price, CAPEX and OPEX
|
Embedded in Text pg. 86
|
|
Figure 20: NPV vs. Percent of Resources Recovered
|
Embedded in Text pg. 90
|
Preliminary Assessment, Lost Creek Property
|
Section 3.0
|
|
|
Table S-1: Summary of Mineral Resources, March 2011
|
8
|
|
Table S-2: Project Header House and Well Inventory by Resource Area
|
11
|
|
Table S-3: Cash Flow Statement ($US 000s), Lost Creek Project
|
14
|
|
Table S-4: Annual Operating Cost (OPEX) Summary, Lost Creek Project
|
15
|
|
Sections 4.0 through 23.0
|
|
|
Table 1: Permit and Licenses for Lost Creek Project
|
25
|
|
Table 2: Historical Mineral Resource Estimates for the Lost Creek Project Area
|
35
|
|
Table 3: Drilling Summary, Lost Creek Project
|
45
|
|
Table 4: Bottle Roll Leach Test Results, 2005
|
50
|
|
Table 5: Core Sample Metal Values
|
51
|
|
Table 6: Bottle Roll Leach Test Results, 2007
|
51
|
|
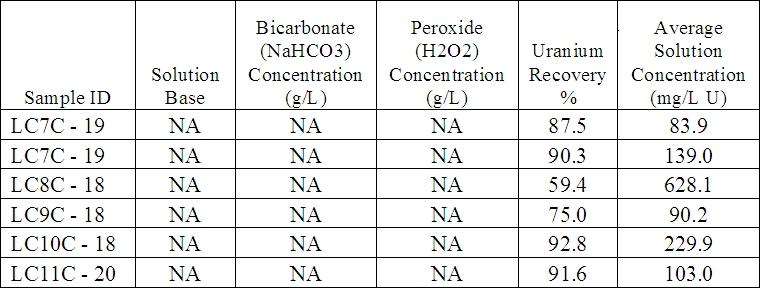
Table 7: KM Horizon Leach Test Results, 2010
|
52
|
|
Table 8: Lost Creek Project Summary of Mineral Resources, March 2011
|
53
|
|
Table 9: Lost Creek Project Summary of Measured and Indicated Mineral Resources, March 2011
|
56
|
|
Table 10: Summary of Measured + Indicated Mineral Resources All Areas
|
57
|
|
Table 11: Summary of Inferred Mineral Resources
|
57
|
|
Table 12: URE Lost Creek Project Resource Estimation February, 2011
|
58
|
|
Table 13: Anticipated Resource Development Plan, Lost Creek Project
|
62
|
|
Table 14: Lost Creek Project Production Schedule
|
62
|
|
Table 15: Project Header House and Well Inventory by Resource Area
|
63
|
|
Table 16: Development and CAPEX Cost Summary, Lost Creek Property
|
70
|
|
Table 17: Annual Operating Costs (OPEX) Summary, Lost Creek Property
|
77
|
|
Table 18: Net Present Value Versus Discount Rate and IRR
|
84
|
|
Table 19: Cash Flow Statement ($US 000s), Lost Creek Property
|
85
|
|
Table 20: Net Present Value Versus Discount Rate and IRR
|
94
|
Preliminary Assessment, Lost Creek Property
Preliminary Assessment
Lost Creek Property
Sweetwater County, Wyoming
Ur-Energy Inc.
This independent Preliminary Assessment (PA) for the Lost Creek Property (the “Property”) has been prepared for Ur-Energy Inc. (URE) and its subsidiary, Lost Creek ISR, LLC (LC) by TREC, Inc. (TREC) and Behre Dolbear & Company (USA), Inc. (Behre Dolbear) in accordance with the guidelines set forth under National Instrument (NI) 43-101 for the submission of technical reports on mineral properties.
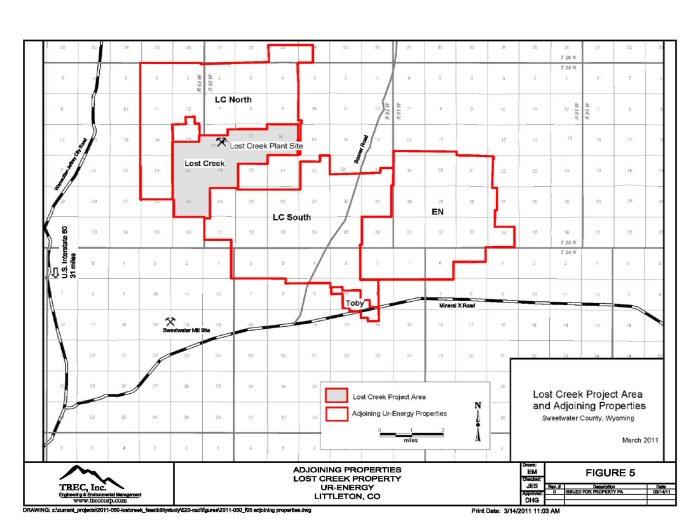
The Lost Creek Property consists of the Lost Creek Project (the “Project”) and the surrounding adjoining claim block areas (the “Adjoining Properties”) known as LC North, LC South, EN and Toby. URE currently controls a total of 1,753 federal unpatented lode mining claims and two State of Wyoming state mineral leases for a total of approximately 33,794 acres in the Lost Creek Property including the Lost Creek Project. For the purposes of this NI 43-101 PA, the combined area controlled by URE is regarded as one material property. All resources reported for the Property are located within the Project area. The Adjoining Properties controlled by URE are considered to be in the exploration stage and do not presently contain any reportable mineral resources under NI 43-101 standards. URE owns 100 percent of the mineral rights on the Property, though some royalties do exist.
The purpose of this PA is to evaluate the technical and economic viability of the Project using the scientific and technical information available at the time of writing. This PA demonstrates both the technical and economic viability of the Project with the current level of available information on the mineral deposit.
The economic analysis provided within this PA focuses on a well-defined portion of the Property (i.e. the Project area) where the current level of delineation drilling provides for confidence that the contained mineralization is of a known grade and tonnage to consider the in-situ recovery (ISR) method. Continued drilling is recommended in this PA so that additional potential mineralization within the Property and Project Area can be defined and later brought into the resource base for economic consideration.
This PA is based on the estimates of Project mineral resources presented in Table S-1 and the mine plan, as currently defined, including the components presented in Table S-2. The economic analysis estimates that the Project will generate net earnings over the life of the Project, before income tax, of $178.96 million. All references to dollars in this report are US Dollars. It is estimated that the Project has an internal rate of return (IRR) of 91 percent and a net present value (NPV) of $118.1 million applying an eight percent discount rate. The estimated cost of uranium produced is $42.65 per pound including all costs, with an estimated operational cost of $19.66 per pound. See Tables S-3 and S-4. The estimated commencement of construction is in Quarter 1 of 2012. Payback is estimated in Quarter 4 of 2013.
Preliminary Assessment, Lost Creek Property
Table S-1:Summary of Mineral Resources, March 2011
|
Lost Creek Project
Summary of Mineral Resources, March 2011
|
|
Resource Category
|
Short Tons
(millions)
|
Grade
(% eU3O8)
|
Pounds eU3O8
(millions)
|
|
Measured
|
2.54
|
0.052
|
2.66
|
|
Indicated
|
2.20
|
0.060
|
2.57
|
|
Measured + Indicated
|
4.731
|
0.055
|
5.221
|
|
Resource Category
|
Short Tons
(millions)
|
Grade
(% eU3O8)
|
Pounds eU3O8
(millions)
|
|
Inferred
|
0.77
|
0.051
|
0.78
|
Notes:
|
1.
|
Sum of Measured and Indicated tons and pounds do not add to the reported total due to rounding.
|
|
2.
|
Mineral resources that are not mineral reserves do not have demonstrated economic viability.
|
|
3.
|
Based on grade cutoff of 0.02 percent eU3O8 and a grade x thickness cutoff of 0.3 GT.
|
|
4.
|
Typical ISR industry practice is to apply a GT cutoff in the range of 0.3 which has generally been determined to be an economical cutoff value. This 0.3 GT cutoff was used in this evaluation without direct relation to an associated price.
|
|
5.
|
Measured, Indicated, and Inferred Mineral Resources as defined in Section 1.2 of NI 43-101 (and the Canadian Institute of Mining, Metallurgy and Petroleum, CIM Definition Standards on Mineral Resources and Mineral Reserves adopted by the CIM Council (the "CIM Definitions Standards").
|
|
6.
|
The economic analysis is based on an 80 percent recovery of the total of mineral resources of:
|
2.66 million pounds of NI 43-101-compliant Measured Mineral Resources in 2.54 million tons, at an average grade of 0.052 percent eU3O8;
2.57 million pounds of NI 43-101-compliant Indicated Mineral Resources, contained in 2.20 million tons, at an average grade of 0.060 percent eU3O8; and
Preliminary Assessment, Lost Creek Property
0.78 million pounds of NI 43-101-compliant Inferred Mineral Resources, contained in 0.77 million tons, at an average grade of 0.051 percent eU3O8.
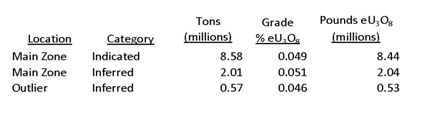
In the preparation of this report, the mineral resources for the Project have been estimated utilizing two distinct technical methods. The first method, consistent with the Technical Report (RPA, 2006) and the Amended Preliminary Assessment of the Lost Creek Project (Lyntek, 2008, as amended 2011) generates a resource estimate for the Project based upon a polygonal method analysis. The polygonal method resource estimate has been verified by Author Robert D. Maxwell, CPG. (See also discussion at Section 20). The polygonal method resource estimate is valid and appropriate for exploration projects. Employing all of the drill data available to date within the Project area, the polygonal method analysis yields 8.44 million pounds, contained in 8.58 million tons, at a grade of 0.049% eU3O8, as an Indicated Mineral Resource, and 2.04 million pounds contained in 2.01 million tons, at a grade of 0.051% eU3O8 as an Inferred Mineral Resource. An additional 0.53 million pounds, contained in 0.57 million tons at a grade of 0.046% eU3O8 as an inferred Mineral Resource is reported from ‘outlier’ areas to the deposit, all within the Project area (See discussion in Section 20.2). This resource calculation approach, as applied, using all identified mineralized zones below the water table, does not yield a result that can confirm the suitability of the resources for the selected mining method.
With the further progression of the Project into stages of mine planning, direct reliance upon the polygonal resource method has been superseded by the grade-thickness (GT) contour method. The GT contour method resource estimate is better suited to guide detailed mine planning and estimates of recoverable resources for a project like Lost Creek. It was therefore utilized for the economic analysis in this report. The GT contour resource estimate has been verified by Author Maxwell using data from Project areas where drilling density is adequate to prepare a detailed mapping of the area and stratigraphic extent of the mineralization. The result identifies mineralization that is of suitable grade and quantity to be recovered by in situ recovery techniques and appropriately supports the estimate of Measured, Indicated and Inferred Mineral Resources presented in Table S-1.
The Authors have elected to use the resource results of the GT contour method in the development of the Property resource estimate because of the higher level of confidence the method produces. The results of the contour method estimate for the Project area include, 2.66 million pounds of Measured Mineral Resources in 2.54 million tons, at an average grade of 0.052 percent eU3O8; 2.57 million pounds of Indicated Mineral Resources, contained in 2.20 million tons, at an average grade of 0.060 percent eU3O8; and 0.78 million pounds of Inferred Mineral Resources, contained in 0.77 million tons, at an average grade of 0.051 percent eU3O8, all deemed suitable for the proposed in situ recovery method. Uranium resources identified and used in this report are defined as of the date of this report and are presented in Table S-1. At the time this report is being prepared, not all of the Project area has been drilled to a density adequate to utilize the GT contour resource estimation method. Additional resources may be identified in the future as additional information becomes available from further drilling activities in the Project and Property areas.
The Project is currently being permitted for commercial production of uranium by in situ methods. The Project is located in the northeastern corner of Sweetwater County, south-central Wyoming, USA. The Project is located in an unpopulated area about 15 miles southwest of Bairoil, Wyoming, about 38 miles northwest of Rawlins, and about 90 miles southwest of Casper. According to the state and federal permit applications, the Project area covers approximately 4,254 acres.
Preliminary Assessment, Lost Creek Property
The Project, as conceived for this PA, will consist of five Resource Areas and associated wellfields and a processing plant (Plant). The Project consists of the proposed development of a commercial uranium in situ recovery and processing operation. This evaluation uses design information provided by URE for the Project and is supplemented with issued-for-bid and final designs for certain facility components (e.g., wellfield piping, Plant, laboratory, header houses, etc.) developed by TREC. Design and bid costs have been used to develop estimates of capital expenditures (CAPEX), operating expenditures (OPEX), and closure costs for the proposed wellfields, Plant, infrastructure and associated facility costs. This PA also presents an economic analysis based on the projected CAPEX and OPEX expenditures, estimates of projected revenue from the sale of uranium concentrates and a schedule of both Project costs and revenues based on assumptions presented herein.
The targeted mineralized zones for in situ uranium recovery at the Project occur within sand horizons of the Eocene age Battle Spring Formation. The primary mineral deposit at the Project occurs within the HJ Horizon. Mineralization targeted for mining has also been identified within the underlying KM Horizon.
The combined HJ and KM mineral trend, generally referred to as the Main Mineral Trend (MMT), extends in an east-northeast to west-southwest orientation for nearly three miles. Composite width of the mineral trend is from 500 to 1500 ft. Individual roll fronts within the deposit are typically 25- to 75-ft wide and are very sinuous. They are stacked vertically and commonly overlie each other in an erratic, anastomosing pattern in plan view.
Thickness of mineralization on each front may vary from five- to 20-ft thick. Typical thickness is from ten to 15 ft. Mineral intercepts of over 25 ft in total thickness are common where multiple roll fronts occur stacked vertically. Average grade of uranium mineralization is approximately 0.055 percent eU3O8.
Depth to mineralization in the HJ Horizon ranges from approximately 350 to 500 ft, averaging 435 ft. In the KM Horizon, it ranges from 525 to 625 ft, averaging 540 ft. Depth increases by roughly 50 to 75 ft in the western portion of the Project and shallows likewise to the east.
For this technical report, an NI 43-101-compliant Mineral Resource estimation was prepared for the Project by URE and was reviewed and validated by Author Robert D. Maxwell, CPG, of Behre Dolbear. This estimate was prepared by the GT contour method, previously described, and identifies approximately 5.22 million pounds at an average grade of 0.055 percent eU3O8, contained in 4.73 million tons and categorized as Measured and Indicated Mineral Resources; and an additional 0.78 million pounds at an average grade of 0.051 percent eU3O8, contained in 0.77 million tons and categorized as an Inferred Mineral Resource.
As identified above, the mineral resources stated in this PA, calculated by the GT contour method (the second method described above), including Measured, Indicated and Inferred Mineral Resources, were reviewed, evaluated and validated by Author Maxwell for use in the economic evaluation. The evaluation included, but was not limited to, review of historical and recent drilling data including geophysical and lithologic logs, available drill hole location and deviation data, mineralization intercept data tables, gamma count readouts, grade thickness contour maps, an evaluation of ground water levels and relative mineralization depths and review of geologic cross sections. As a result of the resource evaluation, defined Measured, Indicated and Inferred Mineral Resources at the Project have been identified. For purposes of this PA, an 80 percent recovery was used, based on site-specific, laboratory recovery test data. Thus, the financial evaluations developed in this study assume approximately 4.81 million pounds of uranium (as U3O8) can be recovered at the Project based on the knowledge of resources developed on the Project at this time.
Preliminary Assessment, Lost Creek Property
The geological mineralized zone is the sandstone unit where economic concentrations of uranium exist and in which the leaching solutions are injected and recovered. It is a saturated zone bounded between other zones of low permeability, typically shales or mudstones, termed aquitards. In order to mine the uranium resources at the Project, infrastructure including wellfields and a Plant have been designed and are planned for construction. Wellfields are located in designated Resource Areas situated above the defined mineralized zone and will feature wells, piping and controls for the ISR process and are sized for the desired production goals. The piping/well system will inject a water-leaching solution into the mineralized zone and recover the uranium-enriched water after it has flowed through the mineralized zone.
Development of the initial Resource Area will begin at the same time Plant construction is initiated. Additional portions and/or wellfield areas will be put into service until the Plant flow capacity is reached. Subsequently, the remainder of the Resource Areas will be developed in such a way as to allow for Plant capacity to be maintained. Eventually, all the patterns in a given Resource Area will reach their economic limit and production flow in that Resource Area will be terminated. At that time, all production flow to the Plant will be derived from the additional Resource Areas and restoration activities will commence in the initial Resource Area. Additional production will be implemented similarly until each area has been depleted at which point groundwater restoration will commence. Further drilling by URE may delineate additional Resource Areas which may be scheduled for future production in a manner similar to the five Resource Areas currently defined for this Project. Table S-2 provides an inventory of header houses and wells included in the Project by Resource Area.
Table S-2:Project Header House and Well Inventory by Resource Area
| |
Resource Areas
|
| Item |
1 |
2 |
3 |
4 |
5 |
|
Header Houses
|
12
|
16
|
4
|
5
|
3
|
|
Injection Wells
|
404
|
562
|
149
|
170
|
102
|
|
Recovery Wells
|
231
|
321
|
85
|
97
|
58
|
|
Interior Monitoring Wells
|
26
|
36
|
18
|
22
|
18
|
|
Perimeter Monitoring Wells
|
28
|
38
|
25
|
23
|
23
|
|
Disposal Wells (2)
|
0
|
0
|
0
|
0
|
0
|
The Plant has been designed to process 6,000 gallons per minute (gpm) of ground water extracted from the mineralized zone with a recovery of approximately one million pounds of dry yellowcake per year through four major solution circuits: the recovery/extraction ion exchange (IX) circuit; the elution circuit; a yellowcake precipitation circuit; and the dewatering, drying and packaging circuit. The evaluation in this PA is based on the one million pound Plant capacity and buildout. Note, however, that URE’s license/permit applications for the Plant are for the processing of up to two million pounds of yellowcake per year (measured as dry yellowcake).
Preliminary Assessment, Lost Creek Property
The system has been designed to recycle and reuse most of the solutions inside each circuit. A bleed will be taken from the overall process to ensure that slightly less water is injected back into the wellfield than was initially recovered to maintain an inward ground water gradient toward the wellfield. This bleed solution will be treated via reverse osmosis and the brine routed to the waste deep disposal wells (DDW). The yellowcake will be packaged in approved 55-gallon steel drums, and transported to a licensed uranium conversion facility.
Using the estimated CAPEX, OPEX and closure costs presented herein, a cash flow statement has been developed and is provided in Table S-3 at page 14. The statement assumes no escalation, no debt, no debt interest or capital repayment and no depreciation or income tax costs. The sale price for the produced uranium is assumed to vary based on the RBC Dominion Securities, Uranium Market Outlook, Fourth Quarter 2010 (RBC, Q4 2010). The revenue for the cash flow estimate was developed using the GT contour mineral resource estimate for the Project, and further assumes that, based on an 80 percent recovery factor for the Resource Areas, approximately 4.81 million pounds of U3O8 will be recovered at the Project.
CAPEX costs were developed by TREC based on the current Project design, quantities and unit costs obtained from various sources. The Authors predict the level of accuracy of the CAPEX estimate is +/- 15 percent. The estimated costs for the major items identified in this study have been sourced in the United States.
OPEX cost estimates were developed by evaluating each process unit operation and associated operating services (power, water, air, waste disposal), infrastructure (offices, change rooms, shop), salary plus burden, and environmental control (heat, air conditioning, monitoring). The OPEX estimate is based on URE’s development plan and associated Resource Areas, deliverables, process flow sheets, process design, materials balance and Project manpower schedule. The Annual OPEX and Closure cost summary is provided in Table S-4 (at page 15). The Authors predict the level of accuracy of the OPEX estimate is +/- 15 percent.
This PA assumes the Project start date is January, 2011. The Project start date is used in the economic analyses presented herein as the demarcation between Project costs and sunk costs. The Project start date is used only for purposes of the economic analysis. It does not define the start of construction or the start of production, both of which will occur after the Project start date.
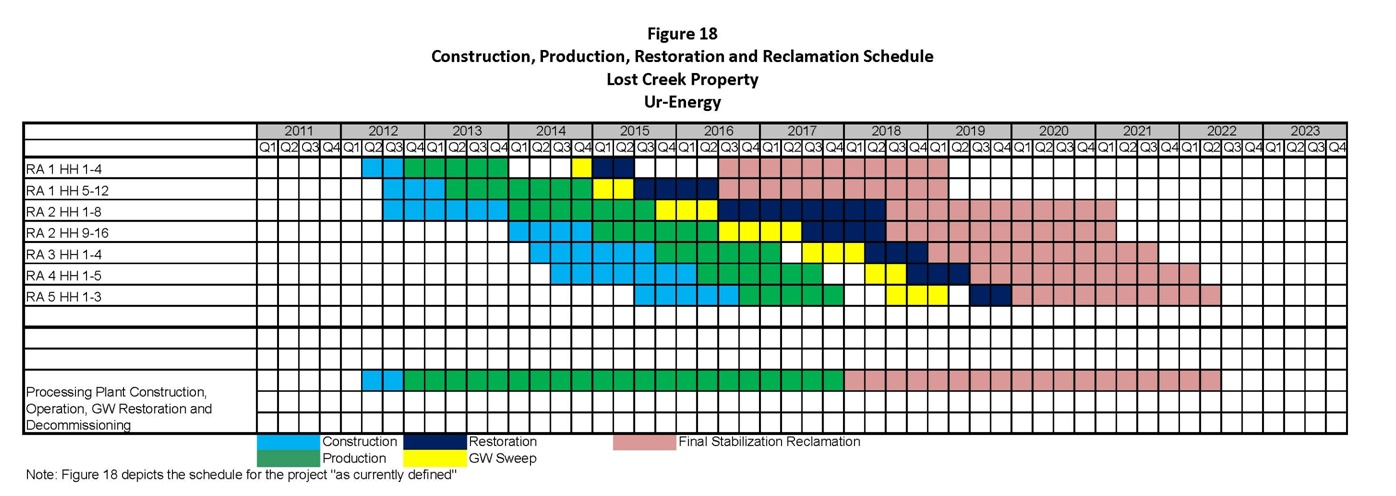
The cash flow includes pre-production costs starting in 2011. The start of production is assumed to be Quarter 4 of 2012 with mining through 2017 and end of restoration and stabilization in 2022. The production plan is subject to change as a result of differences between actual and assumed permit/license approval, extraction schedules, variations with Resource Area recoveries, Plant issues, economic conditions, etc.
The Net Present Value (NPV) calculations make the simplifying assumption that cash flows occur in the middle of the periods. The NPV is calculated from the discounted cash flow model and is based on the CAPEX, OPEX and closure cost estimates, a variable future uranium price (RBC, Q4 2010) and the anticipated production schedule.
Preliminary Assessment, Lost Creek Property
The Project has initial capital costs of $35.06 million including: Plant cost of $17.5 million, pre-production costs of $7.8 million, initial Resource Area construction cost of $5.62 million; and DDW cost $4.125 million. As described above, URE has purchased, or has purchased and partially paid for, some Plant equipment prior to the January 1, 2011 Project start date identified in this PA. Costs for that equipment are considered sunk costs and are not included in the Project totals presented here.
The estimated commencement of construction is in Quarter 1 of 2012. As previously stated, the Project is estimated to generate net earnings over the life of the Project, before income tax, of $178.96 million. Payback is estimated in Quarter 4 of 2013. It is estimated that the Project has an IRR of 91 percent and a NPV of $118.1 million applying an eight percent discount rate. The estimated cost of uranium produced is $42.65 per pound including all costs, with an estimated operation cost of $19.66 per pound. See Tables S-3 and S-4.
Cautionary statement: this PA is preliminary in nature, and includes inferred mineral resources that are considered too speculative geologically to have the economic considerations applied to them that would enable them to be categorized as mineral reserves. The estimated mineral recovery used in this PA is based on both site-specific laboratory recovery data as well as URE personnel and industry experience at similar facilities. There can be no assurance that recovery at this level will be achieved.
Preliminary Assessment, Lost Creek Property
Table S-3: Cash Flow Statement ($US 000s), Lost Creek Project
Table S-3
Cash Flow Statement ($US 000s)
Lost Creek Property
Ur-Energy
|
Uranium Price (3):
|
|
$65.00 |
|
|
$75.00 |
|
|
$80.00 |
|
|
$80.00 |
|
|
$80.00 |
|
|
$80.00 |
|
|
$80.00 |
|
|
$80.00 |
|
|
$70.00 |
|
|
$55.00 |
|
|
$55.00 |
|
|
$55.00 |
|
|
$55.00 |
|
|
|
|
|
Item
|
|
Year -1 (2011)
|
|
|
Year 1 (2012)
|
|
|
Year 2 (2013)
|
|
|
Year 3 (2014)
|
|
|
Year 4 (2015)
|
|
|
Year 5 (2016)
|
|
|
Year 6 (2017)
|
|
|
Year 7 (2018)
|
|
|
Year 8 (2019)
|
|
|
Year 9 (2020)
|
|
|
Year 10 (2021)
|
|
|
Year 11 (2022)
|
|
|
Year 12 (2023)
|
|
|
Total
|
|
|
UR Energy Production ('000 lbs) (1)(2)
|
|
|
0 |
|
|
|
99 |
|
|
|
1,032 |
|
|
|
1,081 |
|
|
|
1,081 |
|
|
|
1,081 |
|
|
|
431 |
|
|
|
0 |
|
|
|
0 |
|
|
|
0 |
|
|
|
0 |
|
|
|
0 |
|
|
|
0 |
|
|
|
4,805 |
|
|
Gross Sales (3)(4)
|
|
$ |
0.0 |
|
|
$ |
7,412.2 |
|
|
$ |
82,567.8 |
|
|
$ |
86,482.8 |
|
|
$ |
86,482.8 |
|
|
$ |
86,482.8 |
|
|
$ |
34,445.5 |
|
|
$ |
0.0 |
|
|
$ |
0.0 |
|
|
$ |
0.0 |
|
|
$ |
0.0 |
|
|
$ |
0.0 |
|
|
$ |
0.0 |
|
|
$ |
383,873.9 |
|
|
less: extraction and private royalty fees at 1.67% royalty
|
|
$ |
0.0 |
|
|
$ |
326.0 |
|
|
$ |
459.0 |
|
|
$ |
459.0 |
|
|
$ |
459.0 |
|
|
$ |
0.0 |
|
|
$ |
91.5 |
|
|
$ |
0.0 |
|
|
$ |
0.0 |
|
|
$ |
0.0 |
|
|
$ |
0.0 |
|
|
$ |
0.0 |
|
|
$ |
0.0 |
|
|
$ |
1,794.7 |
|
|
less: Gross Products+Severance Severance tax (6)
|
|
$ |
0.0 |
|
|
$ |
459.4 |
|
|
$ |
4,961.6 |
|
|
$ |
5,195.8 |
|
|
$ |
5,195.8 |
|
|
$ |
5,173.2 |
|
|
$ |
2,065.0 |
|
|
$ |
0.0 |
|
|
$ |
0.0 |
|
|
$ |
0.0 |
|
|
$ |
0.0 |
|
|
$ |
0.0 |
|
|
$ |
0.0 |
|
|
$ |
23,050.8 |
|
|
Net Sales
|
|
$ |
0.0 |
|
|
$ |
6,626.7 |
|
|
$ |
77,147.1 |
|
|
$ |
80,828.0 |
|
|
$ |
80,828.0 |
|
|
$ |
81,309.6 |
|
|
$ |
32,289.0 |
|
|
$ |
0.0 |
|
|
$ |
0.0 |
|
|
$ |
0.0 |
|
|
$ |
0.0 |
|
|
$ |
0.0 |
|
|
$ |
0.0 |
|
|
$ |
359,028.4 |
|
|
Operational Costs
|
|
|
|
|
|
|
|
|
|
|
|
|
|
|
|
|
|
|
|
|
|
|
|
|
|
|
|
|
|
|
|
|
|
|
|
|
|
|
|
|
|
|
|
|
|
|
|
|
|
|
|
|
|
|
|
|
|
Total Op Costs
|
|
$ |
0.0 |
|
|
$ |
10,057.1 |
|
|
$ |
17,924.5 |
|
|
$ |
14,213.3 |
|
|
$ |
12,354.3 |
|
|
$ |
14,124.5 |
|
|
$ |
8,902.1 |
|
|
$ |
6,786.7 |
|
|
$ |
-736.5 |
|
|
$ |
3,900.1 |
|
|
$ |
-8,153.9 |
|
|
$ |
-8,079.9 |
|
|
$ |
0.0 |
|
|
$ |
71,292.5 |
|
|
Wellfield Development (5)
|
|
$ |
0.0 |
|
|
$ |
5,619.1 |
|
|
$ |
11,238.2 |
|
|
$ |
11,238.2 |
|
|
$ |
11,238.2 |
|
|
$ |
11,238.2 |
|
|
$ |
0.0 |
|
|
$ |
0.0 |
|
|
$ |
0.0 |
|
|
$ |
0.0 |
|
|
$ |
0.0 |
|
|
$ |
0.0 |
|
|
$ |
0.0 |
|
|
$ |
50,572.1 |
|
|
Total Closure Costs
|
|
$ |
0.0 |
|
|
$ |
0.0 |
|
|
$ |
1,057.5 |
|
|
$ |
1,057.5 |
|
|
$ |
1,057.5 |
|
|
$ |
1,057.5 |
|
|
$ |
1,057.5 |
|
|
$ |
1,057.5 |
|
|
$ |
2,115.0 |
|
|
$ |
2,115.0 |
|
|
$ |
4,230.1 |
|
|
$ |
5,287.6 |
|
|
$ |
1,057.5 |
|
|
$ |
21,150.5 |
|
|
Home Office Support and Allocated Overhead
|
|
$ |
175.0 |
|
|
$ |
175.0 |
|
|
$ |
175.0 |
|
|
$ |
175.0 |
|
|
$ |
175.0 |
|
|
$ |
175.0 |
|
|
$ |
175.0 |
|
|
$ |
175.0 |
|
|
$ |
175.0 |
|
|
$ |
175.0 |
|
|
$ |
175.0 |
|
|
$ |
75.0 |
|
|
$ |
0.0 |
|
|
$ |
2,000.0 |
|
|
Project Cash Flow
|
|
$ |
-175.0 |
|
|
$ |
-9,224.5 |
|
|
$ |
46,751.9 |
|
|
$ |
54,143.9 |
|
|
$ |
56,002.9 |
|
|
$ |
54,714.3 |
|
|
$ |
22,154.4 |
|
|
$ |
-8,019.3 |
|
|
$ |
-1,553.6 |
|
|
$ |
-6,190.2 |
|
|
$ |
3,748.8 |
|
|
$ |
2,717.3 |
|
|
$ |
-1,057.5 |
|
|
$ |
214,013.4 |
|
|
Capitalized Costs
|
|
|
|
|
|
|
|
|
|
|
|
|
|
|
|
|
|
|
|
|
|
|
|
|
|
|
|
|
|
|
|
|
|
|
|
|
|
|
|
|
|
|
|
|
|
|
|
|
|
|
|
|
|
|
|
|
|
Pre-Production Costs
|
|
$ |
2,945.6 |
|
|
$ |
4,898.6 |
|
|
$ |
0.0 |
|
|
$ |
0.0 |
|
|
$ |
0.0 |
|
|
$ |
0.0 |
|
|
$ |
0.0 |
|
|
$ |
0.0 |
|
|
$ |
0.0 |
|
|
$ |
0.0 |
|
|
$ |
0.0 |
|
|
$ |
0.0 |
|
|
$ |
0.0 |
|
|
$ |
7,844.2 |
|
|
Capital expenditure (7)
|
|
$ |
5,442.3 |
|
|
$ |
21,769.3 |
|
|
$ |
0.0 |
|
|
$ |
0.0 |
|
|
$ |
0.0 |
|
|
$ |
0.0 |
|
|
$ |
0.0 |
|
|
$ |
0.0 |
|
|
$ |
0.0 |
|
|
$ |
0.0 |
|
|
$ |
0.0 |
|
|
$ |
0.0 |
|
|
$ |
0.0 |
|
|
$ |
27,211.6 |
|
|
CASH FLOW AFTER CAPEX
|
|
$ |
-8,562.9 |
|
|
$ |
-35,892.4 |
|
|
$ |
46,751.9 |
|
|
$ |
54,143.9 |
|
|
$ |
56,002.9 |
|
|
$ |
54,714.3 |
|
|
$ |
22,154.4 |
|
|
$ |
-8,019.3 |
|
|
$ |
-1,553.6 |
|
|
$ |
-6,190.2 |
|
|
$ |
3,748.8 |
|
|
$ |
2,717.3 |
|
|
$ |
-1,057.5 |
|
|
$ |
178,957.6 |
|
|
Opening cash balance
|
|
$ |
0.0 |
|
|
$ |
-8,562.9 |
|
|
$ |
-44,455.3 |
|
|
$ |
2,296.6 |
|
|
$ |
56,440.5 |
|
|
$ |
112,443.4 |
|
|
$ |
167,157.7 |
|
|
$ |
189,312.1 |
|
|
$ |
181,292.8 |
|
|
$ |
179,739.2 |
|
|
$ |
173,549.0 |
|
|
$ |
177,297.8 |
|
|
$ |
180,015.1 |
|
|
|
|
|
|
Closing Cash Balance
|
|
$ |
-8,562.9 |
|
|
$ |
-44,455.3 |
|
|
$ |
2,296.6 |
|
|
$ |
56,440.5 |
|
|
$ |
112,443.4 |
|
|
$ |
167,157.7 |
|
|
$ |
189,312.1 |
|
|
$ |
181,292.8 |
|
|
$ |
179,739.2 |
|
|
$ |
173,549.0 |
|
|
$ |
177,297.8 |
|
|
$ |
180,015.1 |
|
|
$ |
178,957.6 |
|
|
|
|
|
Notes:
|
1.
|
Production is based on a 80% recovery of the total of Measured, Indicated, and Inferred resources per NI 43-101 Section 2.3(3).
|
|
2.
|
Production is in years 2012 through 2017 and assumes applicable permits and licenses are received in time to start production in early 2012.
|
|
3.
|
Uranium Price from RBC Dominion Securities - Uranium Market Outlook, Fourth Quarter 2010.
|
|
4.
|
All amounts in US $ 000s.
|
|
5.
|
Wellfield Development costs after production start are included as an Operational Expense, and averaged between the years of development
|
|
6.
|
Gross products and Severance tax amounts are based on a variable Gross Products Tax rate and Severance Tax rate of 4%.
|
|
7.
|
Plant CAPEX, two deep disposal wells and the first wellfield area (20% of total) are included in Year -1 (2011). Well-field costs are expensed 20% Years 2012-2016.
|
|
8.
|
Income Tax Is Not included In Lost Creek Project Cash Flow.
|
The IRR and NPV analyses are based on Years -1 to Year 12.
|
|
IRR =
|
91% assuming no depreciation, no income tax, no escalation, and variable uranium price as indicated above.
|
|
Net Present Value Versus Discount Rate
|
| |
|
|
|
Discount Rate
|
|
NPV ($US 000s)
|
|
5%
|
|
$137,587
|
|
8%
|
|
$118,052
|
|
10%
|
|
$106,773
|
Preliminary Assessment, Lost Creek Property
Table S-4: Annual Operating Cost (OPEX) Summary, Lost Creek Project
TABLE S-4
Annual Operating Cost (OPEX) Summary
Lost Creek Property
Ur-Energy
|
Life of Mine Operation Costs
|
|
Year -1 (2011)
|
|
|
Year 1 (2012)
|
|
|
Year 2 (2013)
|
|
|
Year 3 (2014)
|
|
|
Year 4 (2015)
|
|
|
Year 5 (2016)
|
|
|
Year 6 (2017)
|
|
|
Year 7 (2018)
|
|
|
Year 8 (2019)
|
|
|
Year 9 (2020)
|
|
|
Year 10 (2021)
|
|
|
Year 11 (2022)
|
|
|
Year 12 (2023)
|
|
|
Total
|
|
|
Cost per LB
|
|
|
Description
|
|
|
|
|
|
|
|
|
|
|
|
|
|
|
|
|
|
|
|
|
|
|
|
|
|
|
|
|
|
|
|
|
|
|
|
|
|
|
|
|
|
|
|
|
4,804,600 |
|
|
Salaries and Wages (Plant)
|
|
$ |
0 |
|
|
$ |
546,721 |
|
|
$ |
2,186,884 |
|
|
$ |
2,186,884 |
|
|
$ |
2,186,884 |
|
|
$ |
2,186,884 |
|
|
$ |
1,749,507 |
|
|
$ |
1,312,130 |
|
|
$ |
874,754 |
|
|
$ |
874,754 |
|
|
$ |
437,377 |
|
|
$ |
218,688 |
|
|
$ |
0 |
|
|
$ |
14,761,467 |
|
|
$ |
3.38 |
|
|
Salaries and Wages (Wellfield)
|
|
$ |
0 |
|
|
$ |
463,820 |
|
|
$ |
1,855,280 |
|
|
$ |
1,855,280 |
|
|
$ |
1,855,280 |
|
|
$ |
1,855,280 |
|
|
$ |
1,484,224 |
|
|
$ |
1,113,168 |
|
|
$ |
742,112 |
|
|
$ |
742,112 |
|
|
$ |
371,056 |
|
|
$ |
185,528 |
|
|
$ |
0 |
|
|
$ |
12,523,140 |
|
|
$ |
2.87 |
|
|
Wellfield Costs (excludes closure related)
|
|
$ |
0 |
|
|
$ |
687,641 |
|
|
$ |
2,750,566 |
|
|
$ |
2,750,566 |
|
|
$ |
2,750,566 |
|
|
$ |
2,750,566 |
|
|
$ |
2,750,566 |
|
|
$ |
2,200,452 |
|
|
$ |
1,650,339 |
|
|
$ |
1,100,226 |
|
|
$ |
0 |
|
|
$ |
0 |
|
|
$ |
0 |
|
|
$ |
19,391,487 |
|
|
$ |
4.44 |
|
|
Processing Plant Costs (excludes closure related)
|
|
$ |
0 |
|
|
$ |
402,080 |
|
|
$ |
1,608,321 |
|
|
$ |
1,608,321 |
|
|
$ |
1,608,321 |
|
|
$ |
1,608,321 |
|
|
$ |
1,286,657 |
|
|
$ |
964,993 |
|
|
$ |
643,329 |
|
|
$ |
482,496 |
|
|
$ |
0 |
|
|
$ |
0 |
|
|
$ |
0 |
|
|
$ |
10,212,841 |
|
|
$ |
2.34 |
|
|
Plant Power Costs (excludes closure related) (7)
|
|
$ |
0 |
|
|
$ |
235,625 |
|
|
$ |
942,500 |
|
|
$ |
942,500 |
|
|
$ |
942,500 |
|
|
$ |
942,500 |
|
|
$ |
754,000 |
|
|
$ |
565,500 |
|
|
$ |
377,000 |
|
|
$ |
282,750 |
|
|
$ |
0 |
|
|
$ |
0 |
|
|
$ |
0 |
|
|
$ |
5,984,876 |
|
|
$ |
1.37 |
|
|
Product Shipping Costs
|
|
$ |
0 |
|
|
$ |
3,121 |
|
|
$ |
130,370 |
|
|
$ |
136,552 |
|
|
$ |
136,552 |
|
|
$ |
136,552 |
|
|
$ |
54,388 |
|
|
$ |
0 |
|
|
$ |
0 |
|
|
$ |
0 |
|
|
$ |
0 |
|
|
$ |
0 |
|
|
$ |
0 |
|
|
$ |
597,534 |
|
|
$ |
0.14 |
|
|
BLM & State Land Holding & Surface Impact Cost (4)
|
|
$ |
0.0 |
|
|
$ |
29,740.0 |
|
|
$ |
30,700.0 |
|
|
$ |
30,700.0 |
|
|
$ |
30,700.0 |
|
|
$ |
30,700.0 |
|
|
$ |
30,700.0 |
|
|
$ |
30,700.0 |
|
|
$ |
30,700.0 |
|
|
$ |
30,700.0 |
|
|
$ |
30,700.0 |
|
|
$ |
30,700.0 |
|
|
$ |
0.0 |
|
|
$ |
336,740 |
|
|
$ |
0.08 |
|
|
NRC Fees (5)
|
|
$ |
0 |
|
|
$ |
435,320 |
|
|
$ |
125,320 |
|
|
$ |
125,320 |
|
|
$ |
125,320 |
|
|
$ |
94,320 |
|
|
$ |
94,320 |
|
|
$ |
94,320 |
|
|
$ |
94,320 |
|
|
$ |
94,320 |
|
|
$ |
94,320 |
|
|
$ |
94,320 |
|
|
$ |
0 |
|
|
$ |
1,471,520 |
|
|
$ |
0.34 |
|
|
Insurance and Bonding
|
|
$ |
0 |
|
|
$ |
6,338,779 |
|
|
$ |
6,665,028 |
|
|
$ |
3,285,046 |
|
|
$ |
1,595,055 |
|
|
$ |
3,235,340 |
|
|
$ |
-111,505 |
|
|
$ |
-111,505 |
|
|
$ - |
5,082,066 |
|
|
$ |
-61,799 |
|
|
$ - |
8,346,068 |
|
|
$ - |
7,874,589 |
|
|
$ |
0 |
|
|
$ |
-468,285 |
|
|
$ |
-0.11 |
|
|
Subtotal: (10% contingency added to subtotal)
|
|
$ |
0 |
|
|
$ |
10,057,133 |
|
|
$ |
17,924,466 |
|
|
$ |
14,213,286 |
|
|
$ |
12,354,296 |
|
|
$ |
14,124,510 |
|
|
$ |
8,902,143 |
|
|
$ |
6,786,735 |
|
|
$ |
-736,464 |
|
|
$ |
3,900,115 |
|
|
$ - |
8,153,877 |
|
|
$ - |
8,079,888 |
|
|
$ |
0 |
|
|
$ |
71,292,453 |
|
|
|
|
|
|
Closure Costs - less Wages
|
|
$ |
0 |
|
|
$ |
0 |
|
|
$ |
1,057,523 |
|
|
$ |
1,057,523 |
|
|
$ |
1,057,523 |
|
|
$ |
1,057,523 |
|
|
$ |
1,057,523 |
|
|
$ |
1,057,523 |
|
|
$ |
2,115,046 |
|
|
$ |
2,115,046 |
|
|
$ |
4,230,093 |
|
|
$ |
5,287,616 |
|
|
$ |
1,057,523 |
|
|
$ |
21,150,464 |
|
|
$ |
4.40 |
|
|
Home Office Support and Allocated Overhead
|
|
$ |
175,000 |
|
|
$ |
175,000 |
|
|
$ |
175,000 |
|
|
$ |
175,000 |
|
|
$ |
175,000 |
|
|
$ |
175,000 |
|
|
$ |
175,000 |
|
|
$ |
175,000 |
|
|
$ |
175,000 |
|
|
$ |
175,000 |
|
|
$ |
175,000 |
|
|
$ |
75,000 |
|
|
$ |
0 |
|
|
$ |
2,000,000 |
|
|
$ |
0.42 |
|
|
Subtotal:
|
|
$ |
175,000 |
|
|
$ |
175,000 |
|
|
$ |
1,232,523 |
|
|
$ |
1,232,523 |
|
|
$ |
1,232,523 |
|
|
$ |
1,232,523 |
|
|
$ |
1,232,523 |
|
|
$ |
1,232,523 |
|
|
$ |
2,290,046 |
|
|
$ |
2,290,046 |
|
|
$ |
4,405,093 |
|
|
$ |
5,362,616 |
|
|
$ |
1,057,523 |
|
|
$ |
23,150,464 |
|
|
|
|
|
|
TOTAL
|
|
$ |
175,000 |
|
|
$ |
10,232,133 |
|
|
$ |
19,156,989 |
|
|
$ |
15,445,809 |
|
|
$ |
13,586,819 |
|
|
$ |
15,357,033 |
|
|
$ |
10,134,666 |
|
|
$ |
8,019,258 |
|
|
$ |
1,553,582 |
|
|
$ |
6,190,162 |
|
|
$ - |
3,748,784 |
|
|
$ - |
2,717,272 |
|
|
$ |
1,057,523 |
|
|
$ |
94,442,917 |
|
|
$ |
19.66 |
|
Notes:
|
1.
|
Plant and Wellfield Capex is in Year -1 (2011). Wellfield development is in years -1, 1, 2, 3, & 4 (2011 thru 2015).
|
|
2.
|
Costs include 10% contingency
|
|
3.
|
Closure costs assume no salvage value for materials and equipment
|
|
4.
|
BLM land holding cost is an annual assessment of $140 on each of claim (201 total). State fees include $1,280 annual lease plus surface impact of $2/acre
|
|
5.
|
NRC annual fees include $8,320 for Annual Inspections, $50K for NRC Project Manager, $36K for License fees. Dryer Amendment, KM Amendment in Year 2012. Mine Unit Reviews in Years 2012, 2013, 2014, and 2015.
|
|
6.
|
Shipping costs are calculated with 19 ton shipments, $4.00/mile and 1,200 miles to the conversion facility
|
|
7.
|
Power in Year -1 estimated for construction use
|
Preliminary Assessment, Lost Creek Property
The Project is sensitive to changes in the price of uranium as shown in Figure S-1. A one dollar change in the commodity price results in a $3.37 million dollar change (IRR: approximately two percent) to the NPV at a discount rate of eight percent. This analysis is based on a variable commodity price per pound. The Project is also slightly sensitive to changes in either CAPEX or OPEX costs as shown in Figure S-1. A five percent variation in OPEX results in a $3.24 million variation in NPV and a five percent variation in CAPEX results in a $3.02 million variation to the NPV. This analysis is based on an eight percent discount rate and a variable commodity price per pound.
Figure S-1
The estimated quantity of uranium recovered used in this PA is based on site-specific, laboratory recovery tests and previous regional ISR mine experience. A recovery factor of 80 percent is used in this PA. Given the site-specific data, Authors Matthew Yovich, P.E. and Douglass Graves, P.E., believe that the use of the assumed recovery factor is reasonable and appropriate. However, there is no assurance that recovery at such a level will be achieved. Figure S-2, below, illustrates the sensitivity of NPV to uranium recovery. The NPV changes approximately $33.62 million per ten percent change in uranium recovery based on an eight percent discount rate.
The estimated financial results are based on the estimated CAPEX, OPEX and closure costs and assumptions presented in this PA. Additionally, the financial results assume that uranium recovery is consistent with URE’s and TREC’s production model and assumed depletion rate.
Preliminary Assessment, Lost Creek Property
Figure S-2
The Authors have assumed that URE’s operations at the Project will be conducted in conformance with applicable laws, regulations and requirements of the various federal and state agencies. It is also assumed that organization and management controls will be established to ensure compliance and further implement URE’s policy for providing a safe working environment including the philosophy of maintaining radiation exposures as low as is reasonably achievable (ALARA).
The Authors find that the technical and economic viability of the Project is favorable. However, this PA is preliminary in nature and uses inferred as well as measured and indicated resources. The inferred resources used in this PA are too speculative geologically to have the economic considerations applied to them that would enable them to be categorized as mineral reserves. There is no certainty that the mineral recovery or the economics presented in this PA will be realized. This PA is based on the assumptions and information presented herein.
Preliminary Assessment, Lost Creek Property
Based on the findings herein, the Authors recommend that URE continues to pursue this Project. This report also identifies a number of additional recommendations including pursuit and execution of an 11(e).2 Byproduct/Waste Disposal Agreement; performance of additional delineation drilling in Resource Areas containing Indicated and Inferred Mineral Resources, and performance of further drilling along the mineralization trends to define any additional target areas both within the Project area and on the Adjoining Properties. Additionally, it is recommended that URE evaluate and pursue, if appropriate, permit license amendments to allow the construction and operation of the yellowcake drying circuit, mining of the KM Horizon and other Resource Areas that may be identified on the Project in the future.
Preliminary Assessment, Lost Creek Property
4.1 Report Preparation
TREC, Inc. (TREC), with its subcontractor, Behre Dolbear & Company (USA), Inc. (Behre Dolbear), has been retained by Ur-Energy Inc. (URE) to prepare this independent Preliminary Assessment (PA) for the Lost Creek Property (the Property), which includes the Lost Creek Project (the Project) (see Figures 1 and 2) and the Adjoining Properties located in northwestern Sweetwater County in south-central Wyoming, USA. This PA has been prepared for URE in accordance with the guidelines set forth under National Instrument (NI) 43-101 for the submission of technical reports on mineral properties. This PA also presents an independent validation of the estimate of Measured, Indicated and Inferred Mineral Resources as defined in Section 1.2 of NI 43-101. Estimates of or conversion to Mineral Reserves are not included. The nature of the mineralized areas and the type of recovery planned do not lend themselves to mineral reserve conversions prior to detailed delineation drilling and, possibly, wellfield development.
4.2 Purpose and Project Description
This report summarizes the results of an independent PA for the Project as prepared by TREC, and was commissioned by URE in February 2011. The PA has been developed to provide an evaluation of the technical and economic viability of the Project and an NI 43-101-compliant estimate of Measured, Indicated and Inferred Mineral Resources.
The Authors have relied on, and take responsibility for, information provided by URE and third parties in good faith and have, to the extent possible, confirmed the accuracy of that information and data provided including that associated with Project geology and mineral resource estimates.
The recommendations and opinions contained in this PA are based on the Authors’ assumptions, presented in this document, and further assume that unknown, unforeseeable, or unavoidable events, which may adversely affect the cost, scheduling or ultimate success of the Project, will not occur. A discussion of the risks associated with Project permitting, construction, operation and financial performance is presented in Section 21.11. Additionally, sensitivity analyses for key risk factors are presented in Section 21.9.
The Project, as currently defined, will consist of surface facilities and wellfields in five Resource Areas to be constructed and operated as an in situ recovery (ISR) uranium mine. The major surface facilities will include a processing plant (the Plant) and deep disposal wells (DDW). The wellfields within the Resource Areas, as currently defined, will occupy a collective surface area of approximately 177 acres.
The Plant has been designed to process 6,000 gallons per minute (gpm) of groundwater extracted from the mineralized zone with a recovery of approximately one million pounds of dry yellowcake per year through four major solution circuits: the recovery/extraction ion exchange (IX) circuit; the elution circuit; a yellowcake precipitation circuit; and the dewatering, drying and packaging circuit. The evaluation in this PA is based on the one million pound Plant capacity and buildout. Note, however, that URE’s license/permit applications for the Plant are for the processing of up to two million pounds of dry yellowcake per year.
Preliminary Assessment, Lost Creek Property
4.3 Terms of Reference
Units of measurement, unless otherwise indicated, are feet (ft), miles, acres, pounds avoirdupois (lbs.), and short tons (2,000 lbs.). Uranium production is expressed as pounds U3O8, the standard market unit. Grades reported for historical resources and the mineral resources reported and used herein are percent eU3O8 (equivalent U3O8 by calibrated geophysical logging unit). ISR refers to in situ recovery, sometimes also termed ISL or in situ leach. Unless otherwise indicated, all references to dollars ($) refer to United States currency.
4.4 Sources of Information
This PA was prepared by TREC and is based on information provided by URE and other professional consultants, and generally accepted uranium ISR practices. Mineral resource estimates are based on exploration and delineation drilling, and associated data, provided by URE and independently evaluated by Robert D. Maxwell, CPG, of Behre Dolbear.
The wellfield design includes the anticipated wellfield layout provided by URE with associated numbers and locations of wells and header houses. The cost estimates presented herein are based on wellfield layouts, process flow diagrams, tank and process equipment sizes and locations, building dimensions, personnel and capital equipment requirements provided by URE.
The Capital Cost (CAPEX) and Operating Cost (OPEX) estimates were developed primarily from URE bid information, TREC cost data, historical information, and vendor quotes for similar ISR projects currently being designed or in production in the United States. URE has developed bid-level designs and has proceeded significantly in the procurement of capital materials and equipment for the Project, where available, costs and quantities from the design, actual purchase orders and contracts have been used. Mineral recovery and performance were assumed based on data provided by URE as well as recovery and performance of similar ISR projects. Unit costs were based on similar facilities, internal budgets, and obtained from vendor quotes and TREC data. Financial modeling was performed by TREC based on anticipated operating schedules and internal costs, local and state taxes and royalties.
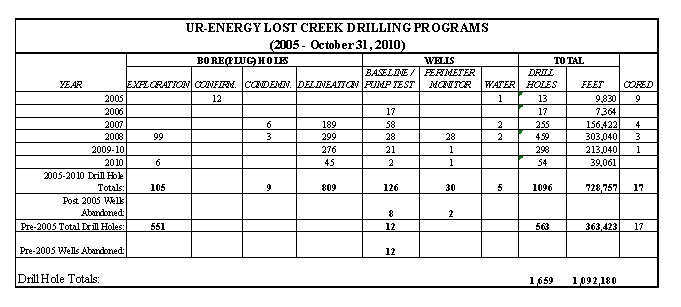
The CAPEX and OPEX estimates are based on total production of 4.81 million pounds (rounded) of U3O8. CAPEX and OPEX costs are presented in 2011 US dollars. No allowance for escalation has been provided. The Authors of this PA predict the accuracy of the estimates at approximately +/- fifteen percent. Exploratory and mine-planning infill drilling within the Project, conducted by URE, is the primary source of information and data for the mineral resource calculations. Data from historical drilling of at least 563 uranium exploration holes conducted by a series of interests including Amax (Climax) Uranium, Conoco, Inexco, Texasgulf and Power Nuclear Corporation were used to supplement URE’s recent drilling data (Section 13.0). The mineral resource estimate is based on published and unpublished data including:
|
|
·
|
Lithologic and geophysical logs, and intercept grade calculations for recent drilling;
|
|
|
·
|
Drill hole location data for recent drilling;
|
|
|
·
|
Mineralization intercept grade calculations;
|
|
|
·
|
Cross sections constructed from geophysical logs of recent and historical drilling.
|
A more detailed discussion of the drilling programs for the Project is provided in Sections 8.1, 8.2 and 13.0.
Preliminary Assessment, Lost Creek Property
4.5 Site Visits
Author Matthew J. Yovich, P.E, conducted a Project site visit on March 5, 2011. The purpose of the trip was to observe the geography and geology of the Project site, verify work done at the site by URE, observe the potential locations of Project components, current site activities, the location of exploration activities and gain knowledge on existing site infrastructure. Though not current with the preparation of this document, Author Robert D. Maxwell, CPG, has previously visited the Project and is familiar with the Project site conditions, geology and mineralization. Author Douglass H. Graves, P.E., did not complete a Project site visit, but has communicated and coordinated with Mr. Yovich contemporaneous with Mr. Yovich’s site visit and during the preparation of this report.
|
5.0
|
Reliance on Other Experts
|
For this Technical Report, the Authors have relied on property ownership information provided by URE and have not independently researched property title or mineral rights for the Project or the Adjoining Properties. The Authors express no legal opinion as to the ownership status of the Project and the Adjoining Properties controlled by URE; the Authors understand, as set forth in Section 6.3, that from time to time formal mineral title reports are prepared for URE by a mineral title attorney, Jack M. Merritts, Lathrop & Gage, LLP, Denver, Colorado.
|
6.0
|
Property Description and Location
|
6.1 Location and Size
The Lost Creek Property, which includes the Lost Creek Project and the Adjoining Properties, is located in the northeastern corner of Sweetwater County in south-central Wyoming. The Project is a subset of the Property located at a latitude and longitude of approximately 42 degrees, 8.06 minutes North by 107 degrees, 51.7 minutes West of the 6th Prime Meridian, in Sections 13, 24 and 25 of T25N, R93W and Sections 16 through 20 and 30 of T25N, R92W in Sweetwater County, Wyoming. The Project area covers approximately 4,254 acres including approximately 4,194 acres in federal unpatented lode mining claims, one state lease and approximately 60 acres of access roads. The Property covers approximately 33,794 acres.
For reference purposes, a normal township consists of 36 sections with each section being one square mile, or six sections by six sections totaling approximately 36 square miles.
As shown on Figures 2 and 3, the Project Area is in an unpopulated area located approximately 15 miles southwest of Bairoil, Wyoming, about 38 miles northwest of Rawlins, and about 90 miles southwest of Casper.
6.2 Mining Claims, Mineral Leases and Surface Use Agreements
Within the Project, URE has 201 federal unpatented lode mining claims and a state uranium and associated minerals lease totaling approximately 4,194 acres as shown on Figure 4. Collectively, within the Adjoining Properties, URE has an additional 1,552 federal unpatented lode mining claims and one state uranium and associated minerals lease, totaling approximately 29,450 acres. These Adjoining Properties include LC North, LC South, EN and Toby as shown on Figure 5.
Preliminary Assessment, Lost Creek Property
6.3 Title to Property
URE, through its wholly-owned subsidiaries Lost Creek ISR, LLC (Lost Creek Project) and NFU Wyoming, LLC (Adjoining Properties) controls the unpatented lode mining claims and State of Wyoming leases which comprise the Lost Creek Property. Title to the mining claims is subject to rights of pedis possessio against all third-party claimants as long as the claims are maintained. The mining claims do not have an expiration date. Affidavits must be filed annually with the BLM and the Sweetwater County Recorder attesting to the payment of annual maintenance fees to the BLM as are set by law from time to time. The surface of the mining claims is all owned by the BLM with URE possessing the right to use so much of the surface as is necessary for mining of the claims, subject, however, to compliance with all federal, state and local laws and regulations. The state leases have a ten-year term, subject to renewal for successive ten-year terms. The Authors understand that, from time to time, formal mineral title reports are prepared for URE by a mineral title attorney, Jack M. Merritts, Lathrop & Gage, LLP, Denver, Colorado.
6.4 Property Boundaries
A professional legal survey of the permit area boundary of the Project was completed in advance of the submission of applications for permits and licenses on the Project. Legal surveys of individual, federal unpatented lode mining claims are not required, and, to the Authors’ knowledge, have not been completed. The area covered by the state leases is based on the legal subdivision descriptions as set forth by the U.S. Cadastral Survey and, to the Authors’ knowledge, have not been verified by legal survey.
6.5 Mineralized Areas, Surface Disturbance and Existing Mine Workings
Mineral resources are located in the sand horizons of the Eocene-age Battle Spring Formation. The primary mineral deposit at the Project occurs within the HJ Horizon. Mineralization targeted for mining has also been identified within the underlying KM Horizon. There are no pre-existing mineral processing facilities or related tailings ponds or waste deposits within the Project area. URE currently has a Drill Notification in effect for the Project (see additional information in Section 6.8). The proposed Project Plant and associated access road will be located as shown on Figure 2. URE has installed numerous monitoring and other wells in support of it permit and license applications and to further its mine planning. Various other infrastructure, including wells, water tanks, office trailers, a meteorological station, and other equipment has been placed on the Project by URE in support of its exploration, mine planning and permit/license activities.
6.6 Royalties, Taxes and Fees
URE will be required to pay various state and local taxes related to production and the ownership of property. These taxes will be in the form of severance, ad valorem, gross products, personal and real property taxes.
Royalties based on sales of uranium will be paid to the state under the state lease at the Project and to royalty interest owners on 20 federal unpatented lode mining claims (the TONY claims) at the Project. The royalty on the TONY claims is a 1.67 percent yellowcake sales royalty. Various royalties exist on the Adjoining Properties. Additionally, maintenance fees will be paid to the BLM, and payments made to the state for the state leases, as described in Section 6.3.
Preliminary Assessment, Lost Creek Property
There is no state income tax in Wyoming at this time but income from this Project will be included in URE’s federal income tax returns. The cost of corporate income tax is not included in this analysis. All other taxes, royalties and fees are included. These costs are discussed in more detail in Section 21.4.
6.7 Environmental Liabilities
6.7.1 Residual Liabilities
As part of the mine permit and licensing process, detailed environmental baseline evaluations have been performed to characterize environmental conditions at the Project. No significant residual liabilities were identified. Also, as part of the ISR planning process, URE has performed exploration drilling for uranium, and delineation drilling for mine planning purposes. In conjunction with this drilling, URE has installed a combination of 151 monitor and water supply wells. These relatively shallow wells (generally less than 1,000 feet in depth) each have a surety bond posted to insure they are properly plugged, abandoned and that surface reclamation is performed. In addition, URE has installed a 10,000-foot-deep steel-cased well with the intention of completing it as a UIC Class I disposal well. This well also has a surety bond posted for plugging, abandonment and surface reclamation. URE’s only other known liability is surface reclamation of exploration drill sites and exploration access roads; all surface disturbance is bonded pending approvals of reclamation. URE has agreed in the Permit to Mine Application for the Project to attempt to locate and re-plug historical drill holes within the wellfield areas to ensure proper abandonment. However, the historical holes are not known to present a significant environmental liability.
6.7.2 Environmental Management and Regulation
To the Authors’ knowledge, operations at the Project site and facilities are currently conducted in conformance with applicable laws, regulations and requirements of the various federal and state agencies. Future conformance with these various laws, regulations and requirements is assumed. The organization and management controls outlined below will be established by URE to ensure compliance and further implement URE’s policy to provide a safe working environment including the philosophy of maintaining radiation exposures as low as is reasonably achievable (ALARA):
|
|
·
|
Management Control Program,
|
|
|
·
|
Management Audit and Inspection Program,
|
|
|
·
|
Qualifications for Personnel Conducting the Radiation Safety Program,
|
|
|
·
|
Radiation Safety Training,
|
|
|
·
|
Radiation Safety Controls and Monitoring.
|
6.8 Permits Required to Conduct Work
The status of URE’s permitting for the Project is as follows:
URE has successfully obtained the following permits, licenses and approvals.
|
|
·
|
Permit to Appropriate Groundwater (Wyoming State Engineer’s Office (WSEO)),
|
|
|
·
|
Permit for Storage Ponds (WSEO),
|
Preliminary Assessment, Lost Creek Property
|
|
·
|
Underground Injection Control (UIC) Permit (Class I) (Wyoming Department of Environmental Quality (WDEQ)),
|
|
|
·
|
WYPDES (construction storm water, WDEQ),
|
|
|
·
|
Air Quality Permit (WDEQ),
|
|
|
·
|
County Development Permit (Sweetwater County), and
|
|
|
·
|
Septic System (Sweetwater County Planning Commission).
|
URE has submitted applications necessary to obtain the following permits, licenses and approvals.
|
|
·
|
Source and Byproduct Materials License (U.S. Nuclear Regulatory Commission (NRC)),
|
|
|
·
|
Underground Injection Control (UIC) Permit (Class III) (WDEQ),
|
|
|
·
|
Plan of Operations (U.S. Bureau of Land Management (BLM)), and
|
|
|
·
|
Pond Construction Permit (U.S. Environmental Protection Agency (EPA)).
|
The three most significant permits/licenses are (1) the Permit to Mine, to be issued by the WDEQ/Land Quality Division (LQD); (2) the Source and Byproduct Materials License, to be issued by the NRC; and (3) the BLM Plan of Operations. The draft NRC license for the Project was issued on January 11, 2011, and the technical review of the Permit to Mine was completed by the LQD which is moving toward issuance of the permit.
Any injection or pumping operations will require permits from the WDEQ which has authority under the Safe Water Drinking Act that stems from a grant of primacy from the EPA for administering underground injection control programs in Wyoming.
The various federal and state permits and licenses that are needed for the Project are summarized in Table 1. Prior to the start of mining (the injection of lixiviant into the mineralized zone aquifers), URE will need to obtain all the following necessary permits, licenses, and approvals required by the WDEQ, NRC and BLM.
Preliminary Assessment, Lost Creek Property
Table 1: Permit and Licenses for Lost Creek Project
|
AGENCY
|
PERMIT OR LICENSE
|
STATUS
|
COMMENTS
|
|
FEDERAL
|
|
|
|
|
Nuclear Regulatory Commission
(NRC)
|
Source and Byproduct Material License
|
Application Submitted 10/30/07
|
Draft License issued on January 11, 2011. Issuance of the Supplemental Environmental Impact Statement (SEIS) and final license is forthcoming
|
|
Environmental Protection Agency
(EPA)
|
UIC Class I & Class III Wells
|
-
|
See WDEQ permits Wyoming has primacy for all applicable EPA programs
|
|
Aquifer Reclassification
|
Being prepared by WDEQ-WQD
|
EPA will have 30 days to comment on the WDEQ-WQD aquifer reclassification but authority to approve the reclassification lies with WDEQ-WQD
|
|
Bureau of Land Management
(BLM)
|
Plan of Operations
|
Submitted November 17, 2009
|
NEPA analysis is ongoing
|
|
STATE
|
|
|
|
|
Wyoming Department of Environmental Quality - Air Quality Division
(WDEQ-AQD)
|
Air Quality Permit
|
Permit approved January 4, 2010
|
-
|
|
Wyoming Department of Environmental Quality - Land Quality Division
(WDEQ-LQD)
|
License to Mine
|
LQD completed the technical review on February 2, 2011 and is moving toward issuance of the permit
|
In Adjudication File of LQD Permit-to-Mine
|
|
LQD Permit-to-Mine and Underground Injection Control Permit (Class III ISR wells)
|
LQD completed the technical review on February 17, 2011 and is moving toward issuance of the permit
|
Because LQD has primacy for UIC Class III wells, the UIC permit serves as the Permit-to-Mine.
|
|
Wyoming State Engineers Office
(WSEO)
|
Permit to Appropriate Groundwater
|
Submitted for all wells completed to date; will be submitted for all future wells.
|
WSEO permits for surface water and ground- water use are discussed in Sections D6.1.2 & D6.3, respectively, of Appendix D6 of the LQD UIC Class III Permit.
|
|
Permit for Storage Ponds
|
Permit issued May 27, 2010
|
-
|
|
Wyoming Department of Environmental Quality - Water Quality Division
(WDEQ-WQD)
|
Underground Injection Control Permit Class I (deep disposal wells)
|
Permit issued May 28, 2010
|
-
|
|
Aquifer Reclassification
|
Application submitted to WDEQ-LQD on October 20, 2010.
|
WDEQ-LQD and WDEQ-WQD work together to develop a Statement of Basis but WDEQ-WQD will issue the aquifer reclassification.
|
|
General Permit to Discharge Storm Water Associated with Large Construction Activity Under WYPDES
|
Submitted April 2, 2008. Approved per Permit Authorization Number WYR103695.
|
Storm Water Pollution Prevention Plans required per General Permits will be prepared prior to construction & operation & maintained on-site life-of-mine.
|
|
General Authorization to Discharge Storm Water Associated with Mineral Mining Activities Under WYPDES
|
Application will be submitted once LQD Permit-to-Mine is approved
|
|
LOCAL
|
|
Sweetwater County Planning Commission
|
County Development Permit
|
Permit approved December 1, 2009
|
LC presented information about the Project at the County Commissioners’ meeting in October 2007.
|
|
Septic System
|
Permit approved December 1, 2009
|
-
|
Preliminary Assessment, Lost Creek Property
Drilling for both exploration and mine planning has been conducted at the Project. Additional exploratory drilling may be conducted by URE to better identify and define mineralization within specified areas of interest. URE has a Drill Notification (#334) permit from WDEQ/LQD for all exploration drilling at the Project, and thus far has proceeded under notice level operations with the BLM, which will be upgraded to the Plan of Operations when approved. WDEQ/LQD Drill Notifications # 371, 372 and 400 relate to exploration drilling at URE’s LC North, EN and LC South properties, respectively (each, one of the Adjoining Properties).
Additionally, monitoring wells have been installed and monitoring conducted to provide baseline information in support of permit and license applications and to serve future mining needs. The volume and extent of exploration and other drilling is described in detail in Sections 12.0 and 13.0.
The draft NRC license was provided to URE on January 11, 2011. The Authors understand that the NRC has indicated that it remains on schedule to issue the final Source and Byproduct Materials License for the Project prior to the end of the Quarter 2 of 2011. WDEQ completed technical review of the Permit to Mine and the Authors understand WDEQ is moving toward near-term issuance of the Permit to Mine. The BLM considers the Permit to Mine Application to be the Plan of Operations and their review of this document is ongoing. BLM has stated they will rely on the U.S. National Environmental Policy Act (NEPA) documents produced by the NRC to the extent possible. All final permits and licenses required to initiate construction on Project are expected in the last half of 2011.
|
7.0
|
Accessibility, Climate, Local Resources, Infrastructure and Physiography
|
7.1 Topography, Elevation and Vegetation
The Property, including specifically the Project, is located near the north-central part of the Great Divide Basin and occurs at an elevation of approximately 7,000 ft above mean sea level. The Great Divide Basin is an oval-shaped, structural depression, encompassing some 3,500 square miles in south-central Wyoming. The Basin is bounded on the north by the Wind River Range and Granite Mountains, on the east by the Rawlins Uplift, on the south by the Wamsutter Arch and on the west by the Rock Springs Uplift.
Most of the Property consists of flat upland areas and gentle south facing slopes that are dissected by southerly-flowing ephemeral washes. There are no perennial streams on the Project. The vegetation on the Property is dominated by big sagebrush (Artemisia tridentata) which occurs throughout both upland and lowland environmental settings. Big sagebrush is well adapted to the cold winter temperatures and limited precipitation that characterize the Project area. Other vegetation identified at the Property include native cool season, perennial grasses, perennial forbs, cushion plants, semi-shrubs, cacti, shrubs and lichens.
7.2 Access
Access to the Property relies almost exclusively on existing public roads and highways. The local and regional transportation network relevant to the Project consists of primary, secondary, local and unimproved roads (Figures 1 and 2). The road network near the Project consists exclusively of un-maintained, two-track roads that are passable with four-wheel drive vehicles. In addition to the designated routes, there are a number of four-wheel-drive routes that traverse the area for recreation and grazing access, as well as various other uses, including mineral exploration. On a wider basis, from population centers, the Property area is served by: an Interstate Highway (Interstate 80); a US Highway (US 287); Wyoming State routes (SR 220 and 73 to Bairoil); local Carbon, Sweetwater, and Fremont County roads; and BLM roads.
Preliminary Assessment, Lost Creek Property
7.3 Proximity to Population Centers and Transport
The Property is located in a remote area in the Great Divide Basin. The nearest town, Bairoil, with a population of less than 100, is about 15 miles northeast of the Project. The towns of Rawlins, Rock Springs and Casper are approximately 36, 82 and 90 miles from the Project, respectively. Figure 1 shows the locations of these population centers with respect to the Project.
The Sweetwater County population in 2000 was 37,613. Sweetwater County had a population density of 3.6 people per square mile. The majority of the population (89.1 percent) lived in urban clusters -- primarily in Rock Springs and Green River. The Carbon County population was 15,639 in 2000 and was primarily located in the town of Rawlins. Preliminary 2010 census data indicate that Southern Wyoming grew by approximately 14 percent since the year 2000. However, data for specific locales from the 2010 census are not yet available.
7.4 Climate and Operating Season
The Property is located in the intermountain semi-desert ecoregion (Wyoming State Climate Office, 2005), which has cold winters and short, hot summers (Bailey, 1995). The average annual temperatures range from 40 to 52 degrees Fahrenheit (°F) in this eco-region. The average annual precipitation ranges from five to 14 inches (Bailey, 1995). The nearest large bodies of water are the Pathfinder and Seminoe Reservoirs, which are unlikely to affect local climatic conditions because they are approximately 50 miles downwind of the Project. Cold weather may limit the time periods for certain portions of capital construction at the Project, but should not significantly affect the operation of an ISR facility. ISR operations at the Project will be conducted year-round.
Winter conditions will continue to affect exploration and drilling on Adjoining Properties.
The State of Wyoming has developed a Core Area Strategy to help protect the Greater Sage Grouse species within certain “core” areas of Wyoming. The exploration areas of the Adjoining Properties are all within the core area and are thus subject to work activity restrictions from March 1 to July 15 of each year. The timing restriction precludes exploration drilling and other activities which may disturb the sage grouse. Drilling activity is not restricted outside this period. The Core Area Strategy also places limitations on the amount of disturbance within an area. However, these restrictions are flexible enough that it is very unlikely they will ever limit exploration drilling.
The timing restrictions on the Project are somewhat different because the State of Wyoming has recognized that mining projects within core areas must be allowed to operate year-round. Therefore, once construction on the Project begins there will be no timing restrictions on drilling, construction, or operational activities within pre-approved “disturbed” as shown in the Permit to Mine application. These “disturbed” areas include the plant, holding ponds, roads, power lines, wellfields, and Class I wells. While initial construction activities may not begin during the timing restriction, they may continue year-round once initiated. Exploration drilling within the Project area, but outside the pre-defined disturbed area, will still have the timing restrictions. For the Project, there is a five percent cap on anthropogenic disturbance in the area. An analysis of the planned disturbance at the Project revealed that the disturbance total will be about 0.9 percent; far below the five percent limit. The Wyoming Game and Fish Department has reviewed both the Permit to Mine application and the Lost Creek Sage Grouse Protection Plan and subsequently issued a letter approving of the Project.
Preliminary Assessment, Lost Creek Property
7.5 Local Resources and Property Infrastructure
As described in Section 6.2, URE has secured sufficient surface access rights for development of the Project.
The basic infrastructure (power, water, and transportation) necessary to support an ISR mining operation is located within reasonable proximity of the Project. Generally, the proximity of the Project to paved roads will be beneficial with respect to transportation of equipment, supplies, personnel and product to and from the Project. Overhead electrical service is aligned in a north-to-south direction along the western boundary of the Project. It is anticipated that power drops will be made to the Project and distributed to the Plant, offices, wellfields, and other facilities. URE has confirmed that electrical service to the Project is sufficient to power the mine operations without additional service upgrade.
Infrastructure near the Project is predominantly related to oil and gas development, past and present uranium exploration and beneficiation and recreation. There have been several conventional uranium mills and mines and a former ISR project in the vicinity of the Project. As shown on Figure 3, the closest facilities to the Project are the Sweetwater Mill, a conventional uranium mill, currently not operating, and an adjacent mine, located about five miles south-southwest of the center of the Project, with about two miles separating the respective permit boundaries.
Potable water will be obtained from ground water wells developed near the Plant (as discussed in Section 7.5.1 below) and water for ISR operations will be obtained from the operation itself; i.e., the extracted ground water. Therefore, the basic infrastructure (power, water and transportation) necessary to support an ISR mining operation is available and located within reasonable proximity of the Project.
Non-potable water will be supplied by wells developed on the site. Water extracted as part of ISR operations will be recycled for reinjection to the mineralized zone. Mine operations will also require disposal of limited quantities of fluids that cannot be returned to the production aquifers into DDWs. A total of five DDWs have been permitted for the Project while only two are expected to be needed. Two storage ponds, located adjacent to the Plant, will be used to temporarily store the water that will ultimately be disposed of in the DDWs. One of the two DDWs included in this PA has been installed, tested and was used as the basis for permitting the other four wells. The locations of the planned wells are immediately south of the Plant building and the second (already installed) in the extreme south west corner of the Project area. The permitted locations for the other three are in the SW quarter of Section 13 of T25N R93W, the SE quarter of Section 19 of T25N R92W and the SE quarter of Section 17 of T25N R92W.
Although the population nearest the Project site consists mainly of the small community of Bairoil and miscellaneous rural ranch residences, personnel required for construction, and operation are available in the nearby towns of Rawlins, Wamsutter, Rock Springs, and Casper, Wyoming.
Tailings storage areas, waste disposal areas, and heap leach pad(s) will not be a part of the infrastructure for the Project as ISR operations do not require these types of facilities.
Preliminary Assessment, Lost Creek Property
7.6 Hydrogeology/Water Supply
The Project is located within the northeastern portion of the Great Divide Basin. The basin is topographically closed with all surface water draining to the interior of the basin (Figure 6). Available data suggest that groundwater flow within the basin is predominately toward the interior of the basin (Collentine, 1981; Welder, 1966; and Mason, 2005).
The Green Mountains north of the Property is a major recharge area to aquifers within the northeastern portion of the Great Divide Basin (Fisk, 1967). The Rawlins Uplift, Rock Springs Uplift, and Creston Junction, located east, southwest, and southeast, respectively, from the Project area, were also identified as major recharge areas for aquifers within the Great Divide Basin (Fisk, 1967). The main discharge area for the Battle Spring/Wasatch aquifer system is to a series of lakes, springs and playa lake beds near the center of the basin. Ground water potentiometric elevations within the Tertiary aquifer system in the central portion of the basin are generally close to the land surface.
The Battle Spring Formation crops out over most of the northeastern portion of the Great Divide Basin, including all of the Property. The Battle Spring Formation is considered part of the Tertiary aquifer system by Collentine et al. (1981). This aquifer system includes the laterally equivalent Wasatch Formation (to the west and south) and the underlying Fort Union and Lance Formations. The base of the Tertiary aquifer system is marked by the occurrence of the Lewis Shale. The Lewis Shale is generally considered a regional aquitard, although this unit does produce limited amounts of water from sandstone lenses at various locations within the Great Divide Basin and to the south in the Washakie Basin. The Lewis Shale is considered the base of the hydrogeologic sequence of interest within the Great Divide Basin.
Units deeper than the Lewis Shale are generally too deep to economically develop for water supply or have elevated total dissolved solid concentration that renders them unusable for human consumption. Exceptions to this can be found along the very eastern edge of the basin, tens of miles from the Project, where some Lower Cretaceous and older units provide relatively good quality water from shallow depths.
Shallower aquifer systems that can be significant water supply aquifers within the Great Divide Basin include the Quaternary and Upper Tertiary aquifer systems. The shallower aquifer systems are only important sources of ground water in localized areas, typically along the margin of the basin where the Battle Spring Formation is absent. Aquifer systems beneath the Tertiary include the Mesaverde, Frontier, Cloverly, Sundance-Nugget and Paleozoic aquifer systems (Collentine, 1981). In the northeast Great Divide Basin, these aquifer systems are only important sources of water in the vicinity of outcrops near structural highs such as the Rawlins Uplift.
Hydrologic units of interest within the northeast Great Divide Basin from deepest to shallowest:
|
|
·
|
Lewis Shale (aquitard between Tertiary and Cretaceous Mesaverde aquifer systems);
|
|
|
·
|
Fox Hills Formation (Cretaceous);
|
|
|
·
|
Lance Formation (Tertiary aquifer system);
|
|
|
·
|
Fort Union Formation (Tertiary aquifer system);
|
|
|
·
|
Battle Spring Formation-Wasatch Formation (Tertiary aquifer system);
|
|
|
·
|
Undifferentiated Tertiary Formations (Upper Tertiary aquifer system, including Bridger; Uinta, Bishop Conglomerate, Browns Park, and South Pass); and
|
|
|
·
|
Undifferentiated Quaternary Deposits (Quaternary aquifer system).
|
Preliminary Assessment, Lost Creek Property
URE has been collecting lithologic, water level, and pump test data as part of its ongoing evaluation of hydrologic conditions at the Project. In addition to URE’s data acquisition, historical data collected for Texasgulf Minerals and Metals (Texasgulf) (Hydro-Search, Inc., 1982) were used to support this evaluation. Water level measurements, both historical and recent, provide data to assess potentiometric surface, hydraulic gradients and inferred ground water flow directions for the aquifers of interest at the Project. A long-term pump test (Petrotek Engineering Corporation, 2007) and several shorter-term pump tests (Hydro-Engineering, 2007), as well as the pump tests conducted for Texasgulf (Hydro-Search, Inc., 1982), were used to evaluate hydrologic properties of the aquifers of interest, to assess hydraulic characteristics of the confining units, and to evaluate impacts to the hydrologic system of the fault through the Project area. Figure 7 shows the location of the fault.
URE has employed the following nomenclature for the hydrostratigraphic units of interest within the Project. The primary uranium production zone is identified as the HJ Horizon. The HJ Horizon is bounded above and below by aerially extensive confining units identified as the Lost Creek Shale and the Sage Brush Shale, respectively. Overlying the Lost Creek Shale is the FG Horizon. The deepest sand unit in the FG Horizon is considered the overlying aquifer to the HJ Horizon. Beneath the Sage Brush Shale is the KM Horizon. The KM Horizon is a potential secondary production zone and also the underlying aquifer to the HJ Horizon. The shallowest occurrence of groundwater within the Project area occurs within the DE Horizon, which is above the FG Horizon.
DE Horizon --The DE Horizon is the shallowest occurrence of saturation within the Project area, although the horizon is not saturated in all portions of the Project and is not a defined groundwater unit. The DE Horizon consists of a sequence of sands and discontinuous clay/shale units. In the southern part of the Project area, sands of the DE Horizon coalesce with sands of the FG Horizon. The top of the unit ranges from 100 to 200 ft below ground surface (bgs).
FG Horizon -- The top of the FG Horizon occurs at depths of approximately 200 to 250 ft bgs on the north side of the fault and 300 to 350 ft below ground surface (bgs) on the south side of the fault within the Project. The total thickness of the FG Horizon is approximately 160 ft. The basal sand unit in the FG Horizon ranges from 20 to 50 ft thick within the Project and is designated as the overlying aquifer for the HJ Horizon.
Lost Creek Shale --Underlying the FG Sands is the Lost Creek Shale. The Lost Creek Shale appears to be continuous across the Project, ranging from five to 45 ft in thickness. Typically, this unit has a thickness of 10 to 25 ft. The Lost Creek Shale is the confining unit between the overlying aquifer (FG Sand) and the HJ Horizon. The confining characteristics of the Lost Creek Shale have been demonstrated with a pump test performed by URE.
HJ Horizon -- The HJ Horizon is the primary target for uranium production at the Project. For purposes of uranium ISR operations, the HJ Horizon has been subdivided into four sub-units the Upper HJ (UHJ), Middle HJ1 (MHJ1), Middle HJ2 (MHJ2) and the Lower (LHJ). These sub-units are generally composed of coarse-grained arkosic sands with thin lenticular intervals of fine sand, mudstone and siltstone. The bulk of the uranium mineralization is present in the two MHJ sub-units. The total thickness of the HJ Horizon ranges from 100 to 160 ft, averaging approximately 120 ft. The top of the HJ Horizon ranges from approximately 300 to 450 ft bgs within the Project. The four sub-units are commonly separated by thin clayey units that are not laterally extensive and, based on pump test results, do not act as confining units to prevent groundwater movement vertically between the HJ sub-units. The underlying aquifer to the HJ Horizon is the KM Horizon, which is also a potential uranium production zone. Therefore, the deepest sub-unit within the HJ Horizon, the LHJ, is also designated as the overlying aquifer to the KM Horizon.
Preliminary Assessment, Lost Creek Property
The HJ Horizon is hydrologically confined, and potentiometric surface data in the HJ Horizon indicate that a fault provides a significant hydraulic barrier to groundwater flow. The potentiometric surface on the north side of the fault is 15 ft higher than on the south side. During the long-term pump test in 2007, the hydraulic barrier effect of the fault was confirmed. Potentiometric data infer that groundwater flows to the west-southwest, generally consistent with the regional flow system.
Sage Brush Shale --Beneath the HJ Horizon is the Sage Brush Shale, with the top of the shale ranging from 450 to 550 ft bgs. The Sage Brush Shale is laterally extensive and ranges from five to 75 ft in thickness. The Sage Brush Shale is the lower confining unit to the HJ Horizon. The confining characteristics of this unit have been demonstrated through pump tests by URE.
KM Horizon -- The KM Horizon is present beneath the Sage Brush Shale. The KM Horizon sand is generally a massive, coarse sandstone with intermittent lenticular fine sandstone and mudstone intervals. The KM Horizon is hydrologically confined and is the underlying aquifer to the HJ Horizon but is also a potential production zone within the Project. The top of the KM Horizon is usually between 450 and 600 ft bgs within the Project. URE’s decision to proceed with a future license amendment for production of the KM Horizon will depend on the results of additional delineation drilling and characterization of the lower confining unit and underlying aquifer.
7.7 Background Radiological Characteristics
Background radiological characteristics for the Project were evaluated in 2006 and 2007 to establish radiological baseline conditions and document the pre-operational radiological environment. The evaluations were performed for surface soils, subsurface soils, sediment and flora. In addition, a baseline gamma survey was performed, and Radon-222 and direct gamma exposure rates were measured.
The results of the study are presented in detail in the “Ur-Energy, Lost Creek ISR Project, Wyoming DEQ Permit to Mine Application” (Ur-Energy, 2007a) and the “Ur-Energy, Lost Creek, U.S.N.R.C. Source Material License Application, 2007” (Ur-Energy, 2007b). In general, the baseline study indicates that most site radiological properties are in normal ranges with a few exceptions. These exceptions include:
|
|
·
|
Baseline gamma – There is an unexpected degree of variability in gamma exposure rates. Some areas with slightly elevated background radiation occurred near Project boundaries. Commonly, there was no visible evidence of certain landscape features in these areas that might help explain such findings (e.g., exposed bedrock outcrops or unusual soil layers). Subsequent correlation sampling, re-scanning, and Health Physics Instrumentation Committee cross-calibration activities confirmed the original readings. The evidence indicates that some portions of Project boundaries fall where natural terrestrial radioactivity is slightly elevated at the soil surface.
|
|
|
·
|
Soils - Statistical analysis demonstrated a significant linear relationship between the mean Radium-226 soil concentration and the mean gamma exposure rate across all of the sampling grids.
|
|
|
·
|
Baseline Radon-222 and direct gamma exposure rates – Radon-222 are higher than national ambient levels but typical for the vicinity. Direct gamma exposure rates are not excessive.
|
Preliminary Assessment, Lost Creek Property
7.8 Other Environmental Investigations
The license and mine permit applications have been developed to define and evaluate the potential for impacts to other environmental resources and have been submitted to NRC and WDEQ. Evaluation subjects included: existing and anticipated land use, transportation, geology, soils and seismology, water resources, climate/meteorology, vegetation, wetlands, wildlife, air quality, noise, and historic and cultural resources. Additionally, socioeconomic characteristics in the vicinity of the Project were evaluated. In these evaluations, no impacts from Project development were identified that could not be mitigated (Ur-Energy, 2007a, 2007b).
Similarly, other ISR operations are in development in the State of Wyoming with permits/licenses either approved or issued in draft stages. Therefore, this PA assumes no substantial or significant additional costs or delays will be borne by URE as a result of impacts to environmental and socioeconomic resources.
8.1 Ownership History of the Lost Creek Property
Uranium was discovered in the Great Divide Basin in 1936. Exploration activity increased in the early 1950s after the Gas Hills District discoveries, and continued to increase in the 1960s, with the discovery of numerous additional occurrences of uranium. Climax-Amax Inc. and Conoco were the earliest operators in the Lost Creek area and made the initial discovery of low-grade mineralization in the Battle Spring Formation in 1968. Kerr-McGee and Valley Development, Inc. were also active in the area. Drilling within the current Project area during the period from 1966 to 1976 consisted of approximately 115 exploration holes by several companies including Conoco, Climax-Amax, and Inexco.
Texasgulf acquired the western half of what is now the Lost Creek Project in 1976 and made the initial identification of the Main Mineralized Trend (MMT). In 1978 Texasgulf optioned a 50 percent interest in the adjoining Conoco ground to the east and continued drilling, fully defining the MMT eastward to the current Project boundary. During this period Texasgulf drilled approximately 412 exploration holes within what is now the Lost Creek Project boundary. This included 12 monitor wells and 16 cored holes. Texasgulf dropped the project in 1983 due to declining economic conditions.
Preliminary Assessment, Lost Creek Property
In 1986, Power Nuclear Corporation (PNC) Exploration of Japan acquired 100 percent interest in the project from Cherokee Exploration, Inc. They carried out an exploration program as well as geologic investigations and an evaluation of previous in situ leach testing. PNC drilled a total of 36 holes within the current Project boundary, including one core hole.
In 2000, New Frontiers Uranium, LLC acquired the property and the database from PNC, but conducted no drilling or geologic studies. New Frontiers Uranium, LLC later transferred the Lost Creek property along with its other Wyoming properties to NFU Wyoming, LLC.
From June 2005 through June 2007, Ur-Energy USA Inc., a wholly-owned subsidiary of URE, purchased 100 percent ownership of NFU Wyoming, LLC. Within the first year of ownership, the company initiated drilling and preparation for mining permit applications. Toward that goal, it conducted engineering studies, core drilling for metallurgical studies, and delineation drilling to outline and define the uranium resources. In addition, comprehensive baseline studies were performed, including installation of additional monitor wells for hydrological testing and water-quality sampling and a meteorological station within the Project area.
In July 2007, NFU Wyoming, LLC transferred the Lost Creek Project to Lost Creek ISR, LLC, a wholly owned subsidiary of Ur-Energy USA Inc. formed for the specific purpose of owning and developing the Project area into an ISR mine. Since 2007, drilling activities on the Project have focused on delineation of previously identified resources in planned production wellfield areas, and installation of monitor and pump-test wells.
The Adjoining Properties, currently held by NFU Wyoming, LLC, have been acquired by the location of federal unpatented lode mining claims, through purchase agreements made with individuals and companies, and through a lease with the State of Wyoming. Collectively, NFU Wyoming, LLC holds 29,540 acres within the Adjoining Properties.
8.2 Exploration and Development Work Undertaken
This section presents a summary of the history and extent of exploration for uranium at the Project.
EXPLORATION HISTORY- Summary of Drilling within the Lost Creek Project:
|
|
Pre-1976:
|
Numerous companies held the property, or portions of the property – Combined drilling: 115 wide-spaced holes.
|
|
|
Initial uranium mineralization was discovered by Climax Uranium (Amax) and Conoco in 1968.
|
|
|
1976:
|
Texasgulf optioned property from Valley Development Inc.
37 exploration holes drilled (west half of current Project area).
|
|
|
1977:
|
Texasgulf identified the main mineral trend (MMT) in the west portion of the current Project area: 129 exploration holes drilled.
|
|
|
1978:
|
Texasgulf obtained a 50 percent interest in the Conoco claims on trend to the east. Continued exploration drilling; 150 holes drilled.
|
|
|
1979:
|
Texasgulf exercised its option with Valley Development: 17 exploration holes drilled. Leach testing was done, aimed at conventional mining.
|
Preliminary Assessment, Lost Creek Property
|
|
1980-1982:
|
Texasgulf continued to define the western portion of the MMT: 79 exploration holes drilled, including 12 pump-test monitor wells. Leach tests were conducted by Wyoming Minerals Corporation on behalf of Texasgulf. The results were deemed of limited usefulness for ISR planning by Stephen Morzenti in a 1997 scoping evaluation by SKM Associates for Strathmore Resources. (SKM, 1997).
|
|
|
1983-1986
|
No exploration drilling activity.
|
|
|
1987:
|
Power Nuclear Corporation (PNC) acquired the properties.
|
|
|
1987-1992
|
PNC drilled 57 exploration holes in the area, including 36 within the current Project boundary and one cored hole.
|
|
|
1992-1999
|
No exploration drilling activity.
|
|
|
2000:
|
PNC sold the properties to New Frontiers Uranium.
|
|
|
2000-2005
|
No exploration drilling activity.
|
|
|
2005
|
URE acquired property.
|
As discussed above, a total of 563 exploration drill holes had been drilled within the Project boundary prior to acquisition by URE. These exploration drill results, in addition to 13 confirmation holes drilled by URE in 2005, comprised the database for the 2006 NI 43-101 resource estimate for the Project by Roscoe-Postle & Associates (RPA, 2006).
No development work had been done on the Project by operators previous to URE. The minor exception to this is the 12 pump-test monitor wells installed by Texasgulf in 1982.
For additional information regarding exploration and development work undertaken, please refer to Sections 12.0 and 13.0.
8.3 Historic Mineral Resource Estimates and Their Reliability
Several historic estimations of mineral resources have been made for the uranium deposits in the general area of the Project. Table 2 outlines the different resource estimates that have been conducted by different entities from 1978 through 2008, including three NI 43-101-compliant resource estimates. The resource estimates encompass different geographical areas, different host sand horizons and utilize different or unknown resource determination methods. Consequently, the various historic estimates cannot be used as a direct comparison with the resource estimate presented in this report. Most of the earlier resource estimates did not identify resources in terms of currently-recognized categories of confidence (Measured, Indicated, Inferred).
Preliminary Assessment, Lost Creek Property
Table 2: Historical Mineral Resource Estimates for the Lost Creek Project Area
| |
|
|
|
|
TOTAL
|
|
|
|
|
|
|
|
|
|
|
|
|
|
|
LEVEL OF CONFIDENCE
|
|
|
DATE
|
|
|
COMPANY
|
|
RESOURCE
(Geol. Inplace)
|
|
|
Avg.
Grade
|
|
|
Cutoffs
|
|
|
TF
|
|
|
Comments
|
|
|
INDICATED
|
|
|
Avg.
Grade
|
|
|
INFERRED
|
|
|
Avg.
grade
|
|
|
10/4/1978
|
|
|
Texasgulf (Freeman,Limbach) 1
|
|
8,246,876 |
|
|
0.045 |
% |
|
10'-0.025%
|
|
|
|
|
|
|
|
|
6,468,515 |
|
|
0.047 |
% |
|
1,778,361 |
|
|
0.039 |
% |
|
2/1/1981
|
|
|
DOE 4
|
|
6,378,000 |
|
|
0.057 |
% |
|
0.03 |
% |
|
|
|
|
p. 31, in-place resources
|
|
|
Not differentiated
|
|
|
2/1/1981
|
|
|
DOE 4
|
|
8,908,571 |
|
|
0.041 |
% |
|
0.02 |
% |
|
|
|
|
p. 31, in-place resources
|
|
|
Not differentiated
|
|
|
2/9/1981
|
|
|
Wyoming Minerals 2,5,4
|
|
11,008,893 |
|
|
0.073 |
% |
|
5'-0.05%
|
|
|
|
|
|
|
|
|
Not differentiated
|
|
|
6/5/1981
|
|
|
Texasgulf 4
|
|
9,072,333 |
|
|
0.061 |
% |
|
5'-0.03%
|
|
|
|
|
|
Polygon method
|
|
|
Not differentiated
|
|
|
April,1982
|
|
|
Texasgulf (Mouillac & Stewart) 3
|
|
5,715,413 |
|
|
0.062 |
% |
|
5'-0.03%
|
|
|
16.0 |
|
|
Polygon method
|
|
|
Differentiated as Class 1 to 4 (not CIM definitions)
|
|
|
3/31/1989
|
|
|
PNC Exploration-Halliwell 5
|
|
8,072,334 |
|
|
0.061 |
% |
|
5'-0.05%
|
|
|
16.0 |
|
|
Polygon method
|
|
|
Not differentiated
|
|
|
Jan. 1996
|
|
|
PNC Exploration (F.Groth) 6
|
|
7,908,605 |
|
|
|
|
|
0.050 |
% |
|
|
|
|
|
|
|
Not differentiated
|
|
|
5/31/2005
|
|
|
URE (Douglas) 7
|
|
9,021,371 |
|
|
0.055 |
% |
|
.03% , GT.30
|
|
|
16.0 |
|
|
Cumulative GT/hole
|
|
|
8,122,287 |
|
|
0.055 |
% |
|
900,000 |
|
|
0.055 |
% |
|
6/15/2006
|
|
|
URE-NI 43-101 (Roscoe-Postle) 8,9
|
|
10,933,736 |
|
|
0.059 |
% |
|
3'-.03%, GT.30
|
|
|
16.0 |
|
|
Cumulative GT/hole (Ind + Inf)
|
|
|
9,822,356 |
|
|
0.058 |
% |
|
1,111,380 |
|
|
0.076 |
% |
|
10/30/2006
|
|
|
URE (Douglas) 10
|
|
6,787,000 |
|
|
0.059 |
% |
|
.03% , GT.30
|
|
|
16.0 |
|
|
Cumulative GT/horizon
|
|
|
|
|
|
|
|
|
|
|
|
|
|
|
4/2/2008
|
|
|
URE-Amended NI 43-101 (Lyntek) 11
|
|
9,900,000 |
|
|
0.054 |
% |
|
.03% , GT.30
|
|
|
16.6 |
|
|
Cumulative GT/hole (Ind + Inf)
|
|
|
9,200,000 |
|
|
0.053 |
% |
|
700,000 |
|
|
0.066 |
% |
|
|
1.
|
Lost Creek- Conoco Reserves; P. Freeman, F. Limbach; October 4, 1978; Texasgulf internal report.
|
|
|
2.
|
Appendix C, Resource Update as of 2/9/81; Unattached document, Texasgulf.
|
|
|
3.
|
Geology and Control of the Uranium Mineralization on the “Main Mineral Trend” – Recommendations for the 1982 Program;. J. Mouillac and M. Stewart, April 1982; Texasgulf internal report.
|
|
|
4.
|
Lost Creek and Conoco Uranium Projects, Texasgulf Minerals and Metals, Inc.; January 1984, p. 31.
|
|
|
5.
|
PNC Exploration (USA), Red Desert Project, D. Halliwell, March 31 1989, p. 17.
|
|
|
6.
|
ISL Addressable Reserve Estimate for PNC’s Red Desert Uranium Project; F. Groth; January 29, 1996; Internal report for PNC.
|
|
|
7.
|
Evaluation of Resources, Lost Creek Uranium Deposit; Richard Douglas, May 31, 2005; Ur-Energy USA, internal report.
|
|
|
8.
|
Technical Report on the Great Divide Basin Uranium Properties, Wyoming Prepared for Ur-Energy Inc.; Stewart Wallis Roscoe Postle, June 15, 2005, Revised October 15, 2005.
|
|
|
9.
|
Technical Report on the Lost Creek Project, Wyoming, NI 43-101 Prepared for Ur-Energy; Stewart Wallis, Roscoe Postle, June 15, 2006.
|
|
|
10.
|
Geological Report on the Lost Creek Uranium Deposit; Richard Douglas, October 30, 2006 Ur-Energy, internal report.
|
|
|
11.
|
Amended NI 43-101 Preliminary Assessment for the Lost Creek Project, April 2, 2008, as amended February 25, 2011; Lyntek, Inc. and C. Stewart Wallis.
|
The first NI 43-101 compliant report for the Project was issued in 2005 within the “Technical Report on the Great Divide Basin Properties, Wyoming” authored by Stewart Wallis of Roscoe Postle Associates (Reference Number 8, above). Resources reported in that document reference an historic estimation by Texasgulf in 1982 (Reference Number 3, above); recommendations for confirmatory drilling were made.
Preliminary Assessment, Lost Creek Property
In 2006, RPA issued an NI 43-101-compliant technical report specific to the Project. It included an estimate of the resources on the Project’s MMT, employing a method which could be considered a modification of the traditional polygonal method. A grade cutoff of 0.03 percent was applied to each mineral intercept. No correlation or discrimination by stratigraphic or mineral horizons was done. All intercepts meeting this criteria in all horizons were accumulated per hole. Holes exceeding a cumulative grade-thickness (GT) value of 0.30 were then plotted on a map and outline polygons were drawn at the 0.30 contours. Thickness and GT values for a given polygon were derived using the numeric average of data from holes within the polygon, and used to calculate resource grade, tons and pounds. Resource confidence levels were categorized by drill spacing density. A tonnage (density) factor of 16.0 cubic feet per ton was used. RPA produced a uranium resource estimation, meeting the cutoff criterion that is an inventory of all mineralization occurring below the water table within the Lost Creek deposit without consideration of their continuity or ISR viability. RPA was of the opinion that the classification of resources, as stated, meets the CIM Definition Standards (Canadian Institute of Mining, Metallurgy and Petroleum, Definition Standards on Mineral Resources and Mineral Reserves adopted by CIM Council) as required by NI 43-101 (RPA, 2006). The Authors consider the 2006 RPA resource estimate reliable as determined by the methods employed in the estimation and for the purposes for which it was prepared.
The 2006 RPA resource estimate was later updated on February 25, 2011 by its primary author Stewart Wallis to include drilling results from the interim period between the 2006 report and April 2, 2008. These resources were then included in an amended version of the NI 43-101 Preliminary Assessment for the Lost Creek Project by Lyntek, Inc., originally dated April 2, 2008 and amended February 25, 2011, then co-authored by Stewart Wallis. The Lyntek/Wallis report used the same general methods and procedures as the 2006 RPA estimate. Lyntek and Wallis were of the opinion that the classification of resources, as stated, meets the CIM Definition Standards as required by NI 43-101 (Lyntek, 2008, as amended 2011). The resulting uranium resource estimate was similar to that of the 2006 report. The Authors consider the Lyntek/Wallis resource estimate reliable as determined by the methods employed in the estimation and for the purposes for which it was prepared. Note that the resource estimate presented in and used in the economic analysis of this PA, described in Section 19.0, employs different resource calculation methods (GT contour) and presents resources for only the HJ and KM Horizons. As stated above, the RPA and Lyntek resource estimates identified resources in all mineralized horizons below the water table using the sum GT polygonal method. See also Section 19.0.
All of the resource estimates in the table above are historic in nature and are superseded by the resource estimates presented in this report.
8.4 Production History
Uranium was first discovered in the Great Divide Basin in 1936 with a dramatic increase in activity starting around the early 1950s. However, within the Property area, there has not been ISR production of uranium nor pilot plant activities. The historical production activities in the region have been from the production of underground and surface mining activities in the Crooks Gap District approximately 25 miles to the north and at the Sweetwater Mine and Mill approximately five miles to the south.
Preliminary Assessment, Lost Creek Property
9.1 Regional, Local, and Property Geology
Regional, local and Property surficial geology in the vicinity of the Project is shown on Figure 7. A stratigraphic chart illustrating the specific project geology is shown in Figure 8. Figure 9 provides a conceptual model of the uranium roll front deposit that typically occurs within the Property.
The Project is situated in the northeastern part of the Great Divide Basin which is underlain by up to 25,000 ft of Paleozoic to Recent sedimentary units. See Figures 7 and 8. The Great Divide Basin and the Washakie Basin to the southwest together comprise the greater Green River Basin, which occupies much of southwestern Wyoming. The Great Divide Basin lies within a unique divergence of the Continental Divide and is bounded by structural uplifts or fault displaced Precambrian rocks, such that now it has internal drainage and an independent hydrogeologic system.
Outcrop in the Great Divide Basin is dominated by the Battle Spring Formation of Eocene age (Figure 7). The dominant lithology in the Battle Spring Formation is coarse arkosic sandstone, interbedded with intermittent mudstone, claystone and siltstone. Deposition occurred as alluvial-fluvial fan deposits within a south-southwest flowing paleodrainage.
The source of the sediments is considered to be the Granite Mountains, approximately 30 to 50 miles to the north. Thickness of the Battle Spring sediments extends to a maximum of 6000 ft.
Approximately six miles southwest of the Project, the Battle Spring Formation interfingers with the Wasatch and Green River Formations of equivalent age within a belt roughly 15 miles wide. The Wasatch and Green River together represent low-energy fluvial, lacustrine and paludal depositional environments.
Deep-seated regional thrust faulting associated with the Wind River thrusting occurs in the central portions of the Basin. The horizontal component of displacement is possibly greater than nine miles. However, displacement does not extend to the surface. Normal faulting is also common throughout the Basin. Preferential orientation is generally east-west. These are relatively local and appear to be late stage events in the structural history of the Basin. Throws are generally less than 200 ft, most commonly less than 50 ft.
Strata within the Great Divide Basin generally exhibit gentle dips of one to three degrees, increasing to as much as 20 degrees in locations along the basin boundaries. Gentle folding during earliest Eocene accompanied thrusting. Mild anticlinal and synclinal structures occur generally in east-west orientations.
Uranium deposits in the Great Divide Basin are found principally in the Battle Spring Formation, which hosts the Project deposit. Lithology within the deposit consists of approximately 60 to 80 percent as weakly consolidated, medium to coarse arkosic sands up to 50 ft thick; and 20 to 40 percent interbedded mudstone and claystone, generally less than 25 ft thick.
Outcrop within the Project is exclusively that of the Battle Spring Formation. Due to the soft nature of the formation, this occurs largely as sub-crop beneath the soil profile. Stratigraphy in the Project has been subdivided into several thick sand horizons with intervening named shales (Figure 8). The primary mineral deposit occurs within the HJ Horizon which is typically 100- to 160-ft thick. Mineralization targeted for mining has also been identified within the underlying KM Horizon which averages approximately 100-ft thick. Both of these sand horizons include local and relatively thin interbeds of mudstone, siltstone, and claystone.
Preliminary Assessment, Lost Creek Property
The HJ Horizon is overlain by the Lost Creek Shale and underlain by the Sagebrush Shale. Both of these shales vary considerably in thickness from 5- to 25-ft thick but are present everywhere within the Project. Lithology of the shale is generally mudstone or claystone, but may include considerable amounts of siltstone and very fine sand. Hydrogeologically, these units represent the overlying Lost Creek Shale and underlying Sage Brush Shale aquitards with relation to the proposed production in the HJ Horizon.
The mineral deposit is bisected by a minor normal fault system referred to as the Lost Creek Fault, consisting of two parallel, en-echelon faults trending east-northeast to west-southwest. Displacement is post-mineralization and consequently has offset the mineral deposit. The easternmost main fault is down-thrown to the south with a maximum displacement of approximately 80 ft, tipping out to zero displacement within the Project. A secondary, sub-parallel fault displays opposite displacement, down to the north, with a maximum displacement of approximately 50 ft. Pump-testing and monitoring on both sides of the fault have demonstrated that the fault plane is sealed and thus represents a hydrologic barrier or boundary.
9.2 Hydrogeology
The Great Divide Basin, in which the Project is located, is a topographically closed system which drains internally, due to a divergence in the Continental Divide. Most of the surface water is runoff from precipitation or snowmelt, and it quickly infiltrates, recharging shallow groundwater, evaporates, or is consumed by plants through evapotranspiration. Alluvial deposits, along drainages, if any, are not extensive, and the shallowest aquifer within the Battle Spring Formation underlying the Project area is unconfined, unconsolidated, and poorly stratified. The shallow water table is typically 80 to 150 ft bgs.
The hydrogeology of the Project site is described in detail above in Section 7.6.
The Technical Report portion of the Lost Creek ISR, LLC application for NRC Source and Byproduct Materials License, Section 2.7, concludes that the uranium bearing sandstones within the upper Battle Spring Formation appear to be suitable targets for ISR operations. The primary production zone aquifer (HJ Horizon) is bounded by laterally extensive upper and lower confining units, as demonstrated by static water level differences and responses to pump tests. Aquifer properties (transmissivity, hydraulic conductivity and storativity) are within the ranges observed at other ISR operations that have successfully extracted uranium. Water quality is generally consistent throughout the hydrostratigraphic units of interest. Elevated radionuclides are present in the groundwater, but this is consistent with the presence of uranium mineralization within the sandstones. The fault acts as a hydraulic barrier to flow and will need to be accounted for in mine unit design and operation (Lost Creek ISR, LLC, 2007a, b). The Authors agree that hydrologic information indicates that the Project is suitable for ISR mining.
Uranium mineralization within the Project occurs as a roll front type deposit typical in most respects of those observed in other Tertiary Basins in Wyoming. The formation of roll front deposits is largely a groundwater process occurring under favorable geochemical conditions. The most favorable host rocks for roll fronts are permeable sandstones within large aquifer systems. Interbedded mudstone, claystone and siltstone are often present and aid in the formation process by focusing groundwater flux.
Preliminary Assessment, Lost Creek Property
Two possible sources of the uranium are speculated. One is uraniferous Oligocene volcaniclasitics which once covered the basin. The second is uraniferous Archean granites in the Granite Mountains north of the basin which represent the provenance of the arkosic sands of the Battle Spring Formation.
Oxygenated surface water passing through the overlying thick sequences of volcaniclastic material, leached metals, including uranium. These enriched fluids may have leached additional uranium from the granitic content of the arkosic sands within the aquifers. The enriched, oxidizing fluids subsequently entered the regional groundwater systems within the basin, migrating down-dip through the aquifers as large oxidizing geochemical cells referred to as a solution fronts.
Uranium precipitated in the form of roll front deposits at the leading edge of the geochemical cells where they encountered reducing geochemical environments within the host sands. Mineral quality was enhanced where groundwater flux was focused horizontally by paleochannels or vertically by mudstone aquitards. Continuity of these conditions produced a significant accumulation of uranium at the reduction-oxidation (redox) interface. In addition, the continued supply of oxygen to the interface leads to degradation of the reducing environment and results in migration down-dip of the redox interface, remobilizing the associated uranium deposit with it.
The reducing environment in the host sand is generally the result of carbonaceous material or leaked reductant gases within the formation. Pyrite is inherently associated with both and contributes to the reducing environment. Reduced sands are typically some shade of gray. The reducing environment is altered by the passage of the oxidizing solution front. At the same time, pyrite and other iron bearing minerals are oxidized to hematite or limonite/goethite and the carbonaceous material is largely destroyed. As a result, altered (oxidized) sands are typically reddish or yellowish in color.
Figure 9 illustrates the geometry and mineralogical model of a typical roll front uranium deposit.
Roll front uranium deposits vary considerably in size and shape, but are generally long, narrow and sinuous. Commonly, a deposit or mineral trend will consist of a composite of multiple, vertically-stacked roll fronts. Additional details of roll front mineralization are presented in Section 11.0. Total length of a mineral trend may extend for several miles. Typical width of an individual roll front is generally 25 to 100 ft. However, in the case of multiple stacked fronts, the composite width may be several hundred feet across. Typical thickness of an individual roll front is roughly five to 25 ft. However, the composite thickness of multiple, vertically stacked fronts may occupy as much as 200 ft.
As described above, the Project deposit is the product of a large regional geochemical cell which resulted in a complex composite of multiple, stacked roll fronts at the terminal end of the cell. The roll front model and the mineralization trends that occur are the basis upon which the development program, including further exploration programs, is planned.
Significant mineral resources in the Project occur within two major stratigraphic horizons within the Battle Spring Formation: the HJ and the KM Horizons. The HJ Horizon carries the large majority of mineral resources that are currently defined and is the subject of the current permitting process. For resource reporting, the HJ Horizon is subdivided into four stratigraphic sub-units. These sub-units have been named the Upper HJ (UHJ), Middle HJ1 (MHJ1), Middle HJ2 (MHJ2) and Lower HJ (LHJ) (See Figure 8). The richest concentration of uranium mineralization occurs in the MHJ sub-horizons. Each sub-unit, in turn, contains multiple individual roll fronts. The HJ Horizon contains a total of 11 individual roll fronts within a stratigraphic interval of approximately 120 ft.
Preliminary Assessment, Lost Creek Property
The KM Horizon underlies the HJ Horizon and contains additional significant mineralization which will be targeted for production later in the mine plan. Mine approvals for the KM Horizon will be addressed by amendment to the pending mine license/permits, when issued. To date, a total of nine individual roll fronts have been identified in the KM Horizon within a stratigraphic interval of approximately 100 ft. Roll fronts in both the HJ and KM Horizons are known to extend beyond the limits of mineral resources defined for this report but the drilling completed to date is insufficient to categorize any portions of the roll fronts, as they extend beyond the deposit, currently defined, as a mineral resource.
Mineralization has also been identified in scattered areas within the FG Horizon, and to a lesser extent, the DE Horizon. The Authors understand that URE currently has no plans to produce FG and DE mineral occurrences. Mineralization has also been recognized in horizons deeper than the KM: the M and N Horizons. URE anticipates future exploration drilling to define the potential of stratigraphic horizons within the Battle Spring Formation below the KM Horizon. There are currently no plans to produce any of these deeper horizons.
As discussed in Section 10.0, Project mineralization is the product of multiple stacked roll fronts occurring at the leading edge of a large oxidizing geochemical cell. Roll fronts within the HJ and KM Horizons, though occupying separate aquifers, are both related to the same regional geochemical cell; one locally advancing farther than the other.
The combined HJ and KM mineral trend, generally referred to as the MMT, extends in a east-northeast to west-southwest orientation for nearly three miles. The composite width of the mineral trend varies from 500 to 1500 ft. Individual roll fronts within the deposit are typically 25- to 75-ft wide and are very sinuous. They are stacked vertically and commonly overlie each other in a complex, erratic, anastomosing pattern in plan view, as illustrated in Figure 10.
Thickness of mineralization on each front may vary from five to 20 ft thick. Typical thickness is from 10 to 15 ft. Strata within the deposit are nearly horizontal, therefore thickness derived from down-hole gamma logs can be considered reasonable measures of true thickness. Mineral intercepts of over 25 ft in total thickness are common where multiple roll fronts occur stacked on top of each other. Average grade within the deposit is approximately 0.055 percent eU3O8.
Depth to mineralization in the HJ Horizon ranges from approximately 320 to 600 ft, averaging 435 ft. In the KM Horizon, mineralization ranges from 425 to 685 ft, averaging 515 ft. Depth to any given unit can vary up to 220 ft from one end of the MMT to the other due to regional dip of one to three degrees and displacement by normal faulting.
The geometry is dominated by the classic “C” or crescent configuration at the redox interface. The highest quality mineralization occurs in the “Nose” zone, just ahead of the leading edge of the oxidizing solution front and near the apex of the crescent or “C” shape that is typical of roll fronts. Ahead of the front, in reduced ground of the “Seepage” zone, mineralization gradually diminishes to barren. The highest grade portion of the front occurs in reduced ground at the leading edge of the solution front in a zone termed the “Nose”. Ahead of the “Nose”, mineral quality gradually decreases in the “Seepage” zone. Trailing behind the “Nose”, in oxidized (altered) ground, are weak remnants of mineralization referred to as “Tails” which have resisted re-mobilization due to association with shales or other lithology of lower permeability and is generally not amenable to ISR.
Preliminary Assessment, Lost Creek Property
Resource calculations presented herein address mineral intercepts in the HJ and KM Horizons only. They have been evaluated using a minimum intercept GT value of 0.30 (ft-%) and a minimum grade cutoff of 0.020 percent eU3O8. Mineral intercepts not making those cutoffs have been excluded from resource calculations. An NI 43-101-compliant estimate of the mineral resources identified in the HJ and KM Horizons is summarized in Section 19.0.
Mineralogy of the zone of interest has been studied in thin section and by XRD analysis. The mineralogical analysis was conducted in 1979 by Russell Honea, and in 2007 by Hazen Research on samples derived from core. Results indicate that the uranium occurs primarily as the mineral coffinite (uranium silicate) as micron- to submicron-size inclusions disseminated in interstitial clay, possibly absorbed by cation exchange; also intimately interspersed through some of the pyrite. Minor amounts of uraninite (uranium oxide) and brannerite (uranium-titanium oxide) have also been identified. Clay rich fractions are predominantly smectite (montmorillonite), with minor kaolinite.
The Hazen Research analysis concluded that uranium should be recoverable by an ISR operation because of the unconsolidated nature of the sandstone and expected diffusion of the lixiviant through the smectite minerals.
Disequilibrium
Disequilibrium in roll front deposits becomes an issue largely because of the possibility of remobilization of uranium during the roll front formation process or possible dispersion by modern oxidizing groundwater and consequent separation from its gamma-emitting daughter products, mostly 214Bi.
Disequilibrium within the Project deposit has been studied extensively. Core of selected mineralized zones from the drilling campaigns conducted from 2005 through 2010 has been analyzed for chemical uranium on one-foot intervals. Detailed comparison of laboratory results with mineralization derived from gamma logs has been performed.
In addition, 191 drill holes have been logged using Prompt Fission Neutron (PFN) technology. The PFN tool provides a direct down-hole analysis of uranium by means of in-place fission of 235U initiated by the emission of high energy neutrons. Output of the PFN logging is in much the same format as that from the gamma logging tool. Comparison of the mineralization reported by each method has been evaluated in detail on a per-mineral intercept basis. For any given intercept, GT values are derived from both the gamma and PFN data. A “Disequilibrium Factor” (DEF) is then reported as the ratio of GT values: PFN GT/gamma GT. Thus, a value greater than 1.0 indicates chemical enrichment compared to gamma, and a value less than 1.0 represents chemical depletion.
PFN technology has been available for use in Project drilling campaigns since 2008. Since then, 401 mineral intercepts within virtually all stratigraphic horizons have been PFN-logged. PFN sampling methods are discussed in Section 14.0. The selection of PFN-logged mineral intercepts targeted all redox and roll front zone conditions, both oxidized and reduced, associated with roll front Tails, Nose and Seepage zones. Detailed evaluation of the results indicates that the Project deposit as a whole is in equilibrium. In general, DEF variability can be considerable, but when charted is quite scattered and appears random. No discernable pattern of DEF in any given area could be detected as an indicator of remobilization. A statistical analysis of the data revealed that the deposit exhibits disequilibrium characteristics consistent with a relatively stable roll front deposit: slight chemical enrichment in reduced facies of the Nose and Seepage zones, where virtually all of the resource resides. Conversely, a slight depletion is recognized in oxidized facies behind the front. A statistical average of all intercepts analyzed with PFN yielded a mean DEF of 1.06, or very slightly enriched.
Preliminary Assessment, Lost Creek Property
Mineral resources for the Project are estimated from gamma data only, and the PFN results confirm that those resources do not need to be adjusted for chemical depletion. A conservative DEF value of 1.0 has been used in resource estimations. See Section 20.1 for additional discussion of disequilibrium.
Mineralization of Adjoining Properties
URE owns 100 percent of the mineral rights on its Adjoining Properties, though some royalties do exist. At the present time, all reportable mineral resources occur only within the Project area. Adjoining Properties controlled by URE are considered to be in the exploration stage and do not contain reportable resources. URE geologists have reviewed data from approximately 725 historical wide-spaced exploration drill holes plus, 201 exploration holes drilled by URE on these properties. Their evaluation has confirmed that the mineralized oxidation-reduction (redox) fronts observed in the Battle Spring Formation in the Project area also exist within the Battle Spring Formation on these Adjoining Properties.
Redox fronts in the Great Divide Basin occur at the leading edge of large regional geochemical oxidation cells (see Section 10.0). Mineralization observed on the Adjoining Properties is believed to be the product of the same regional geochemical cells as those associated with the Lost Creek mineralization. Similar to the Project, the mineralization on the Adjoining Properties appears to occur as multiple stacked fronts, each typically 25- to 100-ft wide. These are found within a stratigraphic interval of over 1,000 ft and within mineral trends which extend for well over ten miles.
URE geologists have evaluated the historic exploration and recent drilling results from all the Adjoining Properties and believe that at least two regional alteration cells can be identified in the Lost Creek region. They believe that the Project deposit is a local, but not unique, occurrence of mineralization within those regional cells. As discussed above, their geological evaluation of the Adjoining Properties has identified a multitude of potential redox fronts stacked from near surface to depths of approximately 1,000 ft, commonly mineralized, and within trends extending well over ten miles. Represented in composite, the cumulative length of these potential fronts is over 120 miles. With this in mind, and employing the Project deposit as a model, URE geologists have projected the potential for a large amount of additional mineral resources within the Adjoining Properties. The Authors note that this potential is conceptual in nature only, and insufficient exploration has occurred to define a mineral resource on any of the Adjoining Properties.
Preliminary Assessment, Lost Creek Property
12.1 Lost Creek Project
At the time URE acquired the property in 2005, the MMT on the Project had been well identified and drilled-out to varying degrees of confidence. In general, drill spacing at that time was approximately:
20 percent spacing 100 ft or less
50 percent spacing roughly 200 ft
30 percent spacing 400 ft or greater.
The previous exploration efforts, conducted in the Project area by numerous companies, are described in Sections 8.1 and 8.2. Since acquiring the property, URE has conducted only limited exploration drilling within the Project boundary. However, exploration drilling has been conducted on Adjoining Properties, as discussed in Section 12.2.
Drilling activities by URE within the Project since 2005 have focused primarily on delineation of previously-identified mineral resources in planned production wellfield areas, and installation of monitor and pump-test wells related to permitting. Nonetheless, in 2008, wide-spaced drilling, conducted at the request of the WDEQ for the purpose of identifying stratigraphic control, did identify new potential mineral trends in previously undrilled portions of the Project area.
URE is in possession of virtually all of the historic drilling data, maps and reports from Conoco, Texasgulf and PNC activities. This includes:
Geophysical logs (with gamma),
Cutting sample and core descriptions for most holes,
Mineral intercept databases,
Location maps and drill location coordinates,
Geological interpretation maps,
Geological and resource estimation reports,
Metallurgical reports, and
Chemical analyses.
URE has conducted confirmation drilling and coring adjacent to selected historical exploration holes with favorable results. In addition, mineral intercept data from previous operators have been evaluated and selectively checked for accuracy by recalculation. Previous mineral intercept grade cutoffs were generally 0.030 percent eU3O8 or 0.025 percent eU3O8. Review of that data has concluded that the historical mineral intercept data is valid and does not warrant recalculation.
12.2 Adjoining Properties
The location of Adjoining Properties is shown on Figure 5. Mineralization on these properties is discussed in Section 11.0.
The LC North property (8,756 acres) is located to the north and to the west of the Project. Historical wide-spaced exploration drilling on this property consisted of 161 drill holes. In 2007, URE drilled 30 exploration holes (29,600 ft) in two areas immediately north of the Project, of which 29 of the drill holes were geophysically logged down hole. The results of this drilling confirmed the existence of mineralization occurring in multiple horizons, many of which correlated stratigraphically with mineralized horizons in the Project area. Six of the drill holes had GT intercepts of ≥ 0.30 between the depths of 580 to 931 ft. Additional drilling is still needed on this property to evaluate the potential of this mineralization.
Preliminary Assessment, Lost Creek Property
The LC South property (10,830 acres) is located to the south and southeast of the Project. In addition, the Toby property (472 acres) adjoins the LC South property at its southern boundary. Historical drilling on the LC South property consisted of 482 drill holes. In 2010, URE drilled 159 exploration holes (101,270 ft) which confirmed numerous individual roll front systems occurring within several stratigraphic horizons correlative to mineralized horizons in the Project. Also, a series of wide-spaced drill holes up to 1,200 ft in depth were part of this exploration program which identified deep oxidation (alteration) that represents the potential for several additional roll front horizons. Further follow-up drilling is required on the LC South property to evaluate the potential of deeper redox fronts.
The EN property (9,482 acres) is adjacent to and east of LC South. URE reports that it has reviewed over 60 historical drill logs from this property. In 2007, three deep stratigraphic holes totaling 8,605 ft were drilled to test mineralization below 2,000 ft which had been identified in an historical, abandoned oil and gas test well. Mineralization in that test well included an intercept of 6.5 ft of 0.10 percent at 2,200 ft depth, indicating that the presence of mineralized redox fronts persists at depth. Results of the three stratigraphic test wells substantiated mineralization and the presence of redox interfaces at that depth. In 2008, approximately two miles to the south, 12 wide-spaced exploration drill holes (maximum depth 1,170 ft) and a water well totaling 11,370 ft were completed on the property. Nine drill holes showed evidence of multiple mineralized horizons between 500 and 950 ft bgs.
Additional drilling is needed throughout these areas in order to correlate mineralized horizons on the Adjoining Properties and to evaluate their potential. URE is developing exploration plans to continue the exploration and evaluation of the stacked, sinuous, mineralized redox fronts identified by drilling on the Adjoining Properties. The Authors understand that a major exploration program of 2,000 to 3,000 drill holes to evaluate the potential of these mineralized redox fronts has been recommended by URE’s geologic staff. The objective of the exploration program will be to identify deposits of roll front uranium that can be mined by ISR methods.
Drilling on the Project prior to acquisition by URE is discussed in Sections 8.1, 8.2 and 12. Since acquiring the Project, URE has drilled a total of 1,096 boreholes and cased wells. The focus of nearly all of this drilling has been to:
|
|
·
|
Support the permit application processes: installation of baseline sampling wells, pump-test wells, wellfield perimeter monitor wells other monitor wells; and
|
|
|
·
|
Delineate resources in proposed production areas in order to facilitate wellfield planning.
|
Only a minor amount of exploration drilling (105 holes) has been done on the Project. Most was done as local extensions of the MMT.
A summary of URE’s drilling programs, and historic holes, to date, is shown as Figure 10.
Preliminary Assessment, Lost Creek Property
Table 3: Drilling Summary, Lost Creek Project
Explanations of Drill hole categories:
Drill Holes are categorized either has “Plug” holes or “Wells”. “Plug holes” are drilled for information only. They are plugged and abandoned as soon as possible after drilling and logging of the hole. “Wells” are holes which have been cased for various long-term purposes.
The purpose of drilling may fall into the following categories:
PLUG DRILLING:
|
|
·
|
Delineation drilling is plug drilling on close spacing for the purpose of defining in detail the quality and extent of potentially minable mineralization. The assumption is that the wellfield planning can be started after completion of the delineation phase of drilling. Delineation drilling generally does not increase resource inventories, but rather will increase the level of confidence of previously-identified mineral resources.
|
|
|
·
|
Exploration drilling is also a form of plug drilling. It implies holes which are drilled outside of a recognized mineral trend, with the goal of identifying new resources.
|
|
|
·
|
Cored hole is a ‘secondary’ categorization. Coring is normally done on only selected intervals within a hole. Rarely is a drill hole cored top to bottom. Coring may be the main goal of the hole, or it can be done during the ‘pilot’ hole phase of any hole drilled for any other purpose.
|
Other types of plug drilling may include:
|
|
·
|
Confirmation drilling for the purpose of verifying historical drill data; or
|
|
|
·
|
Condemnation drilling which is done to substantiate that the proposed Plant or other facility does not overlie significant, and possibly minable, mineralization.
|
Preliminary Assessment, Lost Creek Property
WELLS:
|
|
·
|
Baseline Monitor Wells are drilled to gather water samples and measure water depths for the purpose of characterizing the aquifers before production.
|
|
|
·
|
Pump-Test Wells are also for aquifer characterization by means of conducting a pumping test. Typically a pump test will employ one pump well and several observation wells. Observation wells may be completed in the pumped aquifer or aquifers above or below the pumping well.
|
|
|
·
|
Production Monitor Wells may include:
|
|
|
-
|
Interior Monitor Wells will monitor groundwater in an overlying or underlying aquifer, or possibly within the production aquifer. They are located within the area planned for production.
|
|
|
-
|
Perimeter Monitor Wells are completed in the production aquifer and are arranged in a ring that is offset at a prescribed distance around the production area.
|
|
|
·
|
A Water Supply Well is a well completed to supply water for drilling or any other activity.
|
|
14.0
|
Sampling Method and Approach
|
All mineralization on the Property occurs at depth and does not outcrop. Consequently all testing of the mineralization is accomplished by means of drilling.
Virtually all “sampling” is accomplished by one or more of three methods derived from drilling activities. The greatest amount is accomplished in the form of down-hole gamma logs. All holes drilled for any purpose are gamma logged. Secondly, information is also gathered by PFN (Prompt Fission Neutron) logging of selected mineralized intervals. Finally, a small number of drill holes have been partially cored. Laboratory uranium analyses of core provide the third source of data.
Down-hole Geophysical Logging – Every hole completed on the Property by URE and its predecessors has been geophysically surveyed (logged) using a down-hole electronic probe. Since 2008, URE has accomplished this using a company owned and operated logging unit employing technology from GeoInstruments, Inc. of Nacogdoches, Texas. A qualified independent contractor, Century Geophysical of Tulsa, Oklahoma, was used prior to that time, and continues to be used commonly as a supplement to the company-owned unit. Down-hole measurements included gamma logs, single-point resistance, self-potential and hole deviation.
Gamma logs provide data that is an indirect measurement of uranium content in the host rock. Count per second (cps) measurements of gamma radiation are recorded in one-tenth foot intervals and reported above selected grade cut-off limits on one-half foot intervals. The reportable grade cut-off limits employed at Lost Creek have been: 0.020 percent, 0.030 percent and 0.050 percent. A Department of Energy (DOE) algorithm is used to convert the cps gamma ray readings into an equivalent percent U3O8. Mineralized intervals (intercepts) are then defined by applying the appropriate grade cutoff to report: thickness of each mineralized zone; average grade percent eU3O8 within each thickness interval; depth of the intercept; and the GT, calculated as the thickness multiplied by average grade for each interval.
Various grade cutoffs have been applied for resource estimation throughout the history of the Property. Historical activities generally used a 0.03 percent or 0.025 percent grade cutoff. Earlier URE resource assessments also used a 0.03 percent cutoff. However, the most recent assessments by URE, after 2008, have employed mineral intercepts reported at the 0.02 percent cutoff, recognizing that ISR mining is much less sensitive to grade than it is to GT. The GT cutoff has not been changed and remains at 0.30 GT. Quality control on the logging unit is performed by calibration of the logging unit at the Casper DOE test pit (known source concentration) no less than once a month and, more commonly, once a week. Calibration is performed using industry established procedures. URE maintains detailed calibration records. Additionally, the repeatability of URE’s gamma tool has been tested by logging a hole twice on separate days. Variance (in terms of GT) was approximately five percent.
Preliminary Assessment, Lost Creek Property
PFN Logging – PFN is considered a direct measurement of uranium concentration (percent U3O8) and is used to verify the grades of mineral intercepts reported by gamma logging. Logging is accomplished by a down-hole probe in much the same manner as gamma logs, however only the mineralized interval and a buffer interval above and below are logged.
After review of the gamma logs for each drill hole, the URE field geologists determine if any intercepts warrant PFN logging, based on the GT of the gamma intercepts (GT ≥ 0.10). If selected by the field geologist and if the PFN tool is available in a reasonable timeframe, the hole will be logged by PFN. As such, the PFN results are employed as a confirmation of gamma derived results, but not as a complete replacement or duplication of them. Approximately 20 percent of all holes drilled by URE have been PFN logged.
Quality control for the PFN is performed at the DOE test pit in a manner similar to that described above for the gamma tool. In addition, PFN repeatability has been tested by logging several holes more than once. Variance (in terms of GT) ranged from six to 13 percent. Additionally, two core holes were also logged with the PFN tool. Detailed comparison of the PFN results to the laboratory analyses of core for uranium concentration was made. Variance (in terms of GT) between the PFN and the laboratory results averaged 9.8 percent.
Core Samples – Core samples have been obtained from approximately two percent of the holes drilled by URE. Core holes are located as close offsets of previously drilled holes which showed mineral intercepts of interest. Select intervals within holes of interest were cored by means of a mud-rotary drill-rig employing a 15-ft long, split-tube core barrel. Core recovery has been approximately 95 percent. Core was described in detail and photographed in the field. Additionally the core was scanned on one-half foot intervals with a hand-held scintillometer to identify sections of higher radioactivity for sampling. The scintillometer results were also employed to provide a detailed correlation and comparison to the gamma log results. The core was then vacuum sealed in plastic bags. Samples selected for laboratory analyses were later cut in one foot intervals, split longitudinally and bagged for shipping by URE employees. Analysis was done by qualified laboratories for uranium content, density, permeability and other physical features, as well as leach testing. Samples for leach testing were vacuum sealed again prior to shipping to the lab.
Drill Cutting Samples – During drilling of all holes, cuttings are collected at five-foot intervals. Detailed descriptions of each of these samples are then documented by the field geologists and spoon-sized portions of the samples retained in sealed and labeled chip trays. Drill cutting samples are used only for lithologic evaluation and for description of redox conditions, based on sample color. These samples are not analyzed for uranium content because there is considerable dilution and mixing which occurs as the cuttings are flushed to the surface. In addition, the samples are not definitive with regard to depth due to variation in the lag time between cutting at the drill bit and when the sample is collected at the surface.
Preliminary Assessment, Lost Creek Property
|
15.0
|
Sample Preparation, Analyses and Security
|
After collection and documentation in the field, cores and other physical samples derived from URE’s drilling activities at the Project were delivered to Energy Laboratories, Inc. (Energy) in Casper, Wyoming. Energy has been performing uranium analyses and testing for over 30 years and is considered by the Authors to be qualified to secure, handle and analyze samples in accordance with industry standards. Energy has an industry-standard internal QA/QC system including routine equipment calibration and the use of standards, blanks, duplicates and spikes. Testing of physical properties (porosity, permeability) was also performed by Maxim Technologies (Maxim) of Billings, Montana and Weatherford Laboratories of Casper, Wyoming. Hazen Research, Inc. (Hazen Research) and Assayers Canada performed analysis of duplicate samples. To the Authors’ knowledge, Maxim, Hazen Research and Assayers Canada and Weatherford also maintain and use industry standards for sample security, handling and analysis.
Though specific information is not available to the Authors, data from historical sampling, prior to URE, were assumed to have been collected, secured and analyzed in accordance with standard industry practices at the time. The Authors note that the majority of the data used in the calculation of the resource estimate presented here were derived from activities of URE. Calibration of down-hole gamma and PFN testing with laboratory assay results was performed as described in Section 14.0. The calibration confirmed the ability to appropriately use the down-hole data for resource estimate calculations. Author Robert Maxwell and a TREC geologist reviewed URE Standard Operating Procedure documents and guidelines and found them to be consistent with industry practice
Author Robert Maxwell is of the opinion that the sampling and analysis relevant to the data used in the resource estimate presented herein have been performed to standard industry practices and is acceptable and appropriate for use in the resource estimate.
Tabulations of mineral intercepts compiled by URE were spot-checked against copies of the original down-hole electric logs and the operator’s mineral intercept calculations. Calculations of the grade and thickness of mineralized intercepts by the early operators Amax, Conoco and Texasgulf were done by an accepted method developed by the Atomic Energy Commission. The procedure accounts for, and includes, the gamma radiation beyond the bed boundary. The practice is an industry standard. Calculations of the grade and thickness of mineralized intercepts by URE were made by selecting mineralization above cutoff observed on printouts. Comparison by TREC of log values to the URE tabulation confirmed the validity and accuracy of the procedure.
Areas adjacent to the Property controlled by URE include an area of known uranium mineralization that occurs within the region. There are additional mineralized areas to the south of the Property that have been previously mined for uranium by Minerals Exploration Company (Union Oil of California) up to 1982. The property is known as the Sweetwater Mill and Mine and is now owned by Rio Tinto Americas, Inc. The facility is a conventional uranium mine and mill and it has not operated since 1982. The main open pit operation was about six miles south of URE’s uranium resources on the Lost Creek Project. To date, it is the most significant mining property within the vicinity. There are some properties claimed by others adjacent to the Project, but most of the adjacent federal mining claims surrounding the Property are owned by URE’s subsidiary NFU Wyoming, LLC.
Preliminary Assessment, Lost Creek Property
The Bison Basin Project (approximately 800 acres), is controlled by Wildhorse Energy Ltd, and is approximately 27 miles away from the Property. It is noteworthy since it was an ISR facility that was operated from 1981 to 1982 by the OPI-Western Joint Venture. Operations were suspended in 1982 due to declining prices for uranium. The site was subsequently decommissioned, including aquifer restoration, in the late 1980s. (MineWeb, 2011).
This PA addresses only the Property controlled by URE and not the adjacent properties identified in Figure 3.
The Authors have not verified the information and data from the adjacent properties, and this information is not necessarily indicative of the mineralization on the Property that is the subject of this Technical Report.
The Authors have no material interest in the Property or the adjacent properties discussed above.
|
18.0
|
Mineral Processing and Metallurgical Testing
|
Mineral processing tests were performed on four sets of core samples, beginning in 1979 by Texasgulf. These tests, using bicarbonate lixiviant,resulted in extractions ranging from 60 to 75 percent, while column tests resulted in extractions from 38 to 80 percent with six of the seven tests between 64 and 80 percent extraction. However, these tests were related to hours of leaching rather than pore volumes.
The next tests were conducted by Wyoming Mineral Corporation in 1981, and these tests indicated 81 percent U3O8 extraction for agitation leach tests and 89 percent for columns. Because the sample was partially oxidized prior to the test, the results should not be relied upon (RPA, 2006).
Tests were conducted more recently for URE in 2005 and 2007 by Energy Laboratories. The leach test in 2005 employed five pore volumes in a bottle roll test with a lixiviant of two grams per liter of HCO3 and 500 milligrams per liter of H2O2. The leach tests demonstrated an average recovery of 82.8 percent.
Table 4 presents a summary of the 2005 leach test results.
Preliminary Assessment, Lost Creek Property
Table 4: Bottle Roll Leach Test Results, 2005
The leach test represents one-foot increments within the mineralized zone. Therefore, these results represent specific intervals that were selected for the leach studies. The report is silent on the reasoning for the selection of these specific intervals and why these specific drill holes were selected. Because of this, no conclusions can be drawn regarding leaching of the entire mineralized zone at the location represented by the drill hole. However, these discrete drill hole intervals do demonstrate the range of leaching characteristics shown above. The average recovery is calculated at 82.8 percent with a range of 59.4 to 92.8 percent.
The high grade shown by drill hole LC8C-18 at 0.480 percent U3O8, is about ten times the grade typically observed in the deposit. Moreover, it can be seen that the recovery for this sample is rather low at 59.4 percent. It also shows that the concentration of uranium recovered in the last pore volume was 68.4 milligrams per liter, so obviously additional pore volumes of lixiviant would continue to extract uranium and enhance the recovery estimate. The ultimate recovery, however, cannot be predicted. It can be seen that this principle applies to other samples that were leached. The conclusion is that the samples can be leached with a significant portion of the uranium, about 83 percent, being leached from the samples.
The test in 2007 had the objective of analyzing several lixiviant combinations to provide information on uranium recovery relative to the various lixiviants. The work was performed upon LC Core Hole LC-66C, using the 412 to 420.4 foot interval for compositing and leaching, with grades determined by chemical and radiometric analysis. The moisture in the sample was determined to be 8.53 percent and the metals content are shown in the Table 5. Dry bulk densities were assumed to be 2.0 grams per cubic centimeter and to have 30 percent porosity.
Preliminary Assessment, Lost Creek Property
Table 5: Core Sample Metal Values
|
Analyte
|
mg/kg
|
|
Arsenic
|
2.1
|
|
Molybdenum
|
ND (a)
|
|
Selenium
|
25.5
|
|
Sulfate
|
1,740
|
|
Sulfur
|
581
|
|
Uranium
|
513
|
|
Uranium, U3O8
|
605
|
|
Vanadium
|
7.6
|
|
(a) ND: Not Detected
|
|
Seven bottle roll tests were conducted at ambient pressure and are not designed to approximate in situ conditions, but are only intended to be indicative of the reaction rate. Table 6 presents the combination of lixiviants that were evaluated and are shown with the recovery results for the 2007 leach tests after 30 pore volumes, in five pore volume increments. The variables in the lixiviants were bicarbonate concentration and oxidant strength using ambient groundwater, except for two tests conducted with laboratory grade water. The individual leach periods were 16 hours each.
Table 6: Bottle Roll Leach Test Results, 2007
|
Sample ID
|
Solution Base
|
Bicarbonate (NaHCO3) Concentration (g/L)
|
Peroxide (H2O2) Concentration (g/L)
|
Uranium Recovery %
|
Average Solution Concentration (mg/L U)
|
|
LC 2007-01
|
groundwater
|
Natural
|
0.25
|
34.9
|
51.3
|
|
LC 2007-02
|
groundwater
|
1
|
0.25
|
84.1
|
127.6
|
|
LC 2007-03
|
groundwater
|
1.5
|
0.25
|
91.6
|
139.6
|
|
LC 2007-04
|
groundwater
|
2
|
0.25
|
94.5
|
147
|
|
LC 2007-05
|
groundwater
|
2
|
0.5
|
94.4
|
147.7
|
|
LC 2007-06
|
synthetic H2O
|
2
|
0.25
|
95.7
|
150.1
|
|
LC 2007-07
|
synthetic H2O
|
2
|
0.5
|
94.9
|
151.1
|
These results show that the core is leachable at the lixiviant concentrations shown above, under ambient laboratory conditions. Respectable recoveries can be achieved with lixiviant concentrations greater than 1,500 mg/L bicarbonate and 0.25 g/L peroxide (Lyntek, 2008, as amended 2011).
In 2010, URE has also performed leach testing on samples from the KM Horizon. Those results are presented in Table 7. Seven samples obtained from one-foot sections of core were tested for mineral recovery using the same general test methods as described above at Energy Laboratories. Twenty-five pore volumes of bicarbonate leach solution were passed through the samples.
Preliminary Assessment, Lost Creek Property
Uranium recovery ranged from 54.1 to 93.0 percent with an average uranium recovery of 80.6 percent.
Table 7: KM Horizon Leach Test Results, 2010
|
Sample ID
|
Solution Base
|
Bicarbonate (NaHCO3) Concentration (g/L)
|
Peroxide (H2O2) Concentration (g/L)
|
Uranium Recovery %
|
Average Solution Concentration (mg/L U)
|
|
LC46-01
|
groundwater
|
Natural Bicarb
|
0.25
|
54.1
|
42
|
|
LC46-02
|
groundwater
|
1
|
0.25
|
87.2
|
78.8
|
|
LC46-03
|
groundwater
|
1.5
|
0.25
|
87.7
|
84.6
|
|
LC46-04
|
groundwater
|
2
|
0.25
|
89
|
84.8
|
|
LC46-05
|
groundwater
|
2
|
0.5
|
93
|
92.6
|
|
LC46-06
|
Synthetic Water
|
0.5
|
0.5
|
74
|
66.3
|
|
LC46-07
|
Synthetic Water
|
1
|
0.5
|
88
|
81
|
Based on review of the leach tests, the Authors believe that these tests demonstrate the likely amenability of the mineralized zones to ISR recovery and used the results to develop the estimates of mineral recovery used in this report.
|
19.0
|
Mineral Resource Estimates
|
The mineral resources for the Project have been estimated utilizing the grade-thickness (GT) contour method. The GT contour method resource estimate is well suited to guide detailed mine planning and estimates of recoverable resources for a project like Lost Creek. A discussion of the methodology is presented below in Section 19.3.2 The GT contour method was applied to a well-defined portion of the Lost Creek Project area where the current level of delineation drilling provides for confidence that the contained mineralization is of a known grade and tonnage to consider the in-situ recovery method. Continued delineation drilling is recommended in this PA so that potential additional mineralization within the Project can be defined and later brought into the resource base for economic consideration.
Table 8 presents the resource estimation of the mineral resources determined by the GT contour method for the Lost Creek Project, based on a minimum grade of 0.02 percent eU3O8 and a GT cutoff of 0.3. The table presents an estimate of Measured, Indicated, and Inferred Mineral Resources as defined in Section 1.2 of NI 43-101 (and related CIM Definition Standards).
Preliminary Assessment, Lost Creek Property
Table 8: Lost Creek Project Summary of Mineral Resources, March 2011
|
Resource Category
|
Short Tons
(millions)
|
Grade
(% eU3O8)
|
Pounds eU3O8
(millions)
|
|
Measured
|
2.54
|
0.052
|
2.66
|
|
Indicated
|
2.20
|
0.060
|
2.57
|
|
Measured + Indicated
|
4.731
|
0.055
|
5.221
|
|
Resource Category
|
Short Tons
(millions)
|
Grade
(% eU3O8)
|
Pounds eU3O8
(millions)
|
|
Inferred
|
0.77
|
0.051
|
0.78
|
Notes:
|
|
1.
|
Sum of Measured and Indicated tons and pounds do not add to the reported total due to rounding.
|
|
|
2.
|
Mineral resources that are not mineral reserves do not have demonstrated economic viability.
|
|
|
3.
|
Based on grade cutoff of 0.02 percent eU3O8 and a grade x thickness cutoff of 0.3 GT.
|
|
|
4.
|
Typical ISR industry practice is to apply a GT cutoff in the range of 0.3 which has generally been determined to be an economical cutoff value. This 0.3 GT cutoff was used in this evaluation without direct relation to an associated price.
|
|
|
5.
|
Measured, Indicated, and Inferred Mineral Resources as defined in Section 1.2 of NI 43-101 (and the CIM Definition Standards).
|
19.1 Resource Classification
Resource estimates were prepared using parameters relevant to the possible mining of the deposit by ISR methods. The methodology relies on detailed mapping of mineralization to establish continuity of intercepts in each of the sandstone host units. This method results in a more detailed analysis than methods previously utilized by URE in Project resource estimates, while the Project was in earlier stages.
The mineral resource estimates were reviewed and validated by Robert D. Maxwell, CPG and Senior Associate of Behre Dolbear under contract to TREC. Author Maxwell is of the opinion that the methodology used to estimate the mineral resources is appropriate and is in accordance with industry standards. This Qualified Person is independent of URE and has no material interest in the Lost Creek Property.
19.2 Cutoff Selection
One GT cutoff value was selected to estimate the resources presented herein. A minimum grade of material of 0.02 percent eU3O8 was used. The minimum grade and the 0.30 GT cutoff used in this report are typical of ISR industry practice and represent appropriate values relative to current ISR operations, though they were selected without direct relation to an associated price. Figure 10 presents the 0.3 GT contour mineralization trends for the Project.
Preliminary Assessment, Lost Creek Property
19.3 Assumptions and Methodology
19.3.1 Assumptions
Certain assumptions were incorporated throughout all calculations. The assumptions and methods are as follows:
|
|
1.
|
The radiometric equilibrium multiplier is 1.00.
|
|
|
2.
|
The unit weight of the mineralized zone is 16.6 cubic ft per ton, based on core density measurement results (Maxim Technologies Inc., 2005a, 2005b, 2006).
|
|
|
3.
|
All geophysical logs are assumed to be calibrated per normal accepted protocols, and grade calculations are accurate.
|
19.3.2 Methodology
The Project resources are defined by existing historical and recent drilling information which is of sufficient density to identify significant mineralization trends in the HJ and KM Horizons, as described in Section 11.0 of this report and illustrated in Figures 8 and 10. The mineralization is located in the HJ and KM Horizons of the Battle Spring Formation. The mineralization identified within the HJ Horizon is subdivided into sub-units including the Upper HJ (UHJ), the Middle HJ1 and Middle HJ2 (MHJ1, MHJ2), and the Lower HJ (LHJ). For this report, the sub-units of the KM Horizon are undifferentiated. The grade and mineralized zone thickness were obtained from historical and recent drilling described in Section 13.0. Relevant data regarding parameters of the mineralized zones are provided in Section 11.0.
The mineral resource estimates shown below were estimated by a GT contour method using grades of 0.02 percent eU3O8 or better and a GT cutoff of 0.3 per intercept. Using gamma curve shape and position to characterize the roll front zonation for interpretive bias, mineral intercept values that met the above criteria were contoured using the GT values for each roll front within the sub-units of the HJ and KM Horizons. Figure 10 illustrates the 0.3 GT contour outlines of the mineralization trends of the HJ sub-units and KM Horizon. Figure 11 presents a cross section that illustrates the mineralization that occurs in the HJ and KM Horizons.
The area between each GT contour was assigned the average GT of the upper and lower bounding contour for a given interval. The following equation was utilized by URE for resource estimation:
Mineral Resource pounds eU3O8 = (Area x Average GT x 20 x DEF) / RD
Area (ft2) = Area within a selected GT contour interval (projected to surface)
Avg. GT (% x ft) = Median GT
20 (1% of a ton) = Conversion constant (1 percent of 2000 pounds)
DEF (1.00) = Disequilibrium factor (1.00)
RD (16.6) = Rock Density (Tonnage or Density Factor at 16.6 cubic ft/ton)
Preliminary Assessment, Lost Creek Property
Mineral Resources were identified as Measured, Indicated and Inferred resources based on the density of historical and recent drill hole data. Below is a description of the criteria used to distinguish the resource categories.
Measured: 100-ft center or closer drill hole spacing
Indicated : >100-ft and < 200-ft center drill hole spacing
Inferred: >200-ft and < 400-ft center drill hole spacing
19.4 Summary of Mineral Resources
Measured and Indicated Mineral Resources are summarized in Table 9 by Resource Area. Table 10 summarizes all Measured and Indicated Mineral Resources for the Project.
Preliminary Assessment, Lost Creek Property
|
Table 9:
|
Lost Creek Project Summary of Measured and Indicated Mineral Resources, March 2011
|
|
|
Measured
|
Indicated
|
|
Sub Unit
(Sand)
|
Short tons
(thousands)
|
Average Grade (%eU3O8)
|
Pounds eU3O8 (thousands)
|
Short tons
(thousands)
|
Average Grade (%eU3O8)
|
Pounds eU3O8 (thousands)
|
|
Resource Area 1
|
|
UHJ
|
142
|
0.043
|
122
|
-
|
-
|
-
|
|
MHJ1
|
253
|
0.053
|
269
|
10
|
0.043
|
8.9
|
|
MHJ2
|
808
|
0.064
|
1,042
|
41
|
0.050
|
40
|
|
LHJ
|
349
|
0.039
|
274
|
-
|
-
|
-
|
|
Subtotal 1
|
1,552
|
0.055
|
1,707
|
51
|
0.048
|
49
|
|
Resource Area 2
|
|
UHJ
|
23
|
0.059
|
27
|
48
|
0.065
|
63
|
|
MHJ1
|
87
|
0.047
|
82
|
296
|
0.048
|
285
|
|
MHJ2
|
134
|
0.057
|
153
|
987
|
0.065
|
1,291
|
|
LHJ
|
76
|
0.033
|
50
|
379
|
0.063
|
475
|
|
Subtotal 2
|
320
|
0.049
|
312
|
1,771
|
0.062
|
2,113
|
|
Resource Area 3
|
|
KM
|
554
|
0.048
|
536
|
80
|
0.054
|
86
|
|
Subtotal 3
|
554
|
0.048
|
536
|
80
|
0.054
|
86
|
|
Resource Area 4
|
|
UHJ
|
-
|
-
|
-
|
39
|
0.043
|
34
|
|
MHJ1
|
-
|
-
|
-
|
56
|
0.046
|
52
|
|
MHJ2
|
-
|
-
|
-
|
63
|
0.062
|
77
|
|
LHJ
|
-
|
-
|
-
|
11
|
0.067
|
15
|
|
Subtotal 4
|
-
|
-
|
-
|
169
|
0.042
|
178
|
|
Resource Area 5
|
|
UHJ
|
2.9
|
0.043
|
2.5
|
-
|
-
|
-
|
|
MHJ1
|
17
|
0.042
|
14
|
-
|
-
|
-
|
|
MHJ2
|
82
|
0.046
|
76
|
108
|
0.059
|
127
|
|
LHJ
|
10
|
0.039
|
7.6
|
18
|
0.043
|
15
|
|
Subtotal 5
|
112
|
0.045
|
100
|
125
|
0.057
|
142
|
|
All Measured and Indicated Areas
|
| |
Measured
|
Indicated
|
|
Area 1
|
1,552
|
0.055
|
1,707
|
51
|
0.048
|
49
|
|
Area 2
|
320
|
0.049
|
312
|
1,771
|
0.062
|
2,113
|
|
Area 3
|
554
|
0.048
|
536
|
80
|
0.054
|
86
|
|
Area 4
|
-
|
-
|
-
|
169
|
0.053
|
178
|
|
Area 5
|
112
|
0.045
|
100
|
125
|
0.057
|
142
|
|
TOTAL
|
2,538
|
0.052
|
2,655
|
2,196
|
0.060
|
2,568
|
Note: Section 9.3.2 defines the designation and presents a description of the horizon sub-units.
Preliminary Assessment, Lost Creek Property
Table 10: Summary of Measured + Indicated Mineral Resources All Areas
| |
Short tons
(thousands)
|
Average Grade (%eU3O8)
|
Pounds eU3O8 (thousands)
|
|
TOTAL
|
4,734
|
0.055
|
5,223
|
Inferred Resources are summarized in the Table 11.
Table 11: Summary of Inferred Mineral Resources
|
|
Inferred
|
|
Sub Unit
(Sand)
|
Short tons
(thousands)
|
Average Grade (%eU3O8)
|
Pounds eU3O8 (thousands)
|
|
Resource Area 3
|
|
KM
|
38
|
0.046
|
35
|
|
Subtotal 3
|
38
|
0.046
|
35
|
|
Resource Area 4
|
| UHJ |
64
|
0.046 |
58
|
|
MHJ1
|
161
|
0.049
|
158
|
|
MHJ2
|
305
|
0.049
|
300
|
|
LHJ
|
42
|
0.043
|
36
|
|
Subtotal 4
|
572
|
0.048
|
553
|
|
Resource Area 5
|
| UHJ |
16
|
0.051 |
16
|
|
MHJ1
|
44
|
0.060
|
53
|
|
MHJ2
|
89
|
0.065
|
116
|
|
LHJ
|
14
|
0.039
|
11
|
|
Subtotal 5
|
163
|
0.060
|
195
|
|
All Inferred Areas
|
|
Area 3
|
38
|
0.046
|
35
|
|
Area 4
|
572
|
0.048
|
553
|
|
Area 5
|
163
|
0.060
|
195
|
|
TOTAL
|
773
|
0.051
|
783
|
Note: Section 9.3.2 defines the designation and presents a description of the horizon sub-units.
|
20.0
|
Other Relevant Data and Information
|
20.1 Radiometric Equilibrium
The uranium content used to develop the mineral resource estimate is derived from radiometric geophysical logs from which the uranium content is interpreted. Radiometric equilibrium exists when the ratio of radiometric eU3O8 to chemical U3O8 is 1. This can be determined by obtaining physical samples of the mineralized formation and conducting laboratory analyses of their uranium content, or by modern logging methods including prompt fission neutron logging. A radiometric equivalent multiplier for disequilibrium of 1.0 was used by URE based on confirmation of a favorable disequilibrium discussed in Section 11.0
Preliminary Assessment, Lost Creek Property
20.2 Resource Estimation by Polygonal Method
In order to update the polygonal method resource estimates set forth in the Technical Report (RPA, 2006), and the Preliminary Assessment of the Lost Creek Project (Lyntek, 2008, as amended 2011), a similar study was undertaken by URE incorporating drilling results from 2005 to 2010 (URE, February 2011). This resource estimation utilized a modified polygon method, a grade cutoff of 0.03 percent, and determined a total GT and total thickness for each drill hole. Drill hole data that did not adequately penetrate the HJ Horizon, nor meet the 0.3 GT cut off were not included in the estimation. A 0.3 GT boundary was drawn around the data points, with a limit of 50 feet from the drill hole location if no other data was available (i.e., drill hole below GT cutoff value). The MMT (Main Zone) was divided into polygons. The area for each polygon was determined, along with average grade, thickness and number of holes within a polygon using the sum thickness and total GT.
“Outlier” polygons were also drawn and contain drill holes with mineralization that did not occur within the MMT, but have data that occur above the GT cutoff value.
As was utilized in the calculation of the GT contour method resource estimate, a tonnage factor of 16.6 ft3 per ton was used for the resource calculations, and assumed a disequilibrium factor of 1.0. Classification of the resource categories was made based on drill hole spacing and continuity of mineralization for each polygon. The MMT polygons were assigned indicated or inferred mineral resource categories; all outlier polygons were assigned inferred mineral resource category.
Author Maxwell, conducted a review of the URE resource estimation which included an evaluation of selected geophysical and drill logs, grade calculations, mineralization database and drill hole information summary tables and drill hole location maps. The review also consisted of an evaluation of the spreadsheets and calculations made in the resource estimate, including the polygonal areas and average dimensions and grade used in the resource determination.
The URE resource estimation identifies the resources determined by a modified polygonal method at the Project, based on a minimum grade of 0.03 percent eU3O8 and a GT of 0.3 or greater, and is reported in Table 12. The resource estimation, prepared by URE, was evaluated and validated by Author Maxwell. The Author is of the opinion that the resource estimation is considered valid for the method employed.
Table 12: URE Lost Creek Project Resource Estimation February, 2011
Preliminary Assessment, Lost Creek Property
The three resource estimates (RPA, 2006; Lyntek, 2008 as amended 2011; URE, 2011) used a polygonal method of estimating resources and the resulting estimates of resources are similar. The results of the 2011 polygonal method study for this report confirmed the arithmetic of the original studies. See also discussion Section 8.3.
In applying a polygonal method, the possibility for operator bias (favorable or unfavorable) is largely eliminated by strict guidelines. Also, typical concentrations of drill holes in densely drilled high grade areas are given appropriately balanced credit within a polygonal method analysis. A concern with the application of a polygonal method is that it is dominated by drill hole spacing rather than by deposit geometry. This may lead to different results when compared to estimates that incorporate limits based on deposit geometry and geology. This is the case when comparing the two URE studies using a polygonal method to the recent resource estimate utilizing the GT contour method (described in Section 19.0) that has derived estimates based on mapping of geologic factors of roll front continuity as well as GT values to estimate the areal extent of minable material.
The polygonal method resource estimate is valid and appropriate for exploration projects. The polygonal method includes mineralized zones in stratigraphic horizons not included in the current mine plan orin the resource estimate presented in Section 19.0. The GT contour method resource estimate is better suited to guide detailed mine planning and estimates of recoverable resources for a project like Lost Creek, because it yields a result can be used to confirm the suitability of the resources for the selected mining method; it was therefore chosen for this report and for the economic analysis here. With the further progression of the Project into stages of mine planning, use of the polygonal resource method has been superseded by the GT contour method for being the more appropriate method of estimating mineral resources at the Project.
|
21.0
|
Additional Requirements for Technical Reports
|
This section of the PA presents descriptions for injection, extraction and uranium processing; the cost estimate approach; and assumptions used to develop the capital costs (CAPEX) and operating costs (OPEX). It also includes the economic analyses, project implementation plan, risk assessment and closure cost estimate.
URE plans to mine the Project mineralized zones using the ISR extraction method. This is the same method that is successfully used elsewhere in Wyoming by Cameco Resources, Inc. at the Smith-Highland mine in the southern Powder River Basin and is the same method used successfully in the past by COGEMA (AREVA) at the Irigaray and Christensen Ranch sites.
As depicted on Figure 12, five Resource Areas have been designed to produce uranium from the mineralized zones at the Project. The wells will be typically arranged in five-spot patterns. However, in some situations, URE may use other well patterns to most effectively target the mineralization. Monitor wells will be installed at each Resource Area as dictated by geologic and hydrogeologic parameters, and as approved by the WDEQ/LQD and the NRC. The Plant and appurtenant facilities will be constructed according to accepted engineering practices.
21.1 Wellfields
Wellfields (also referred to as Resource Areas) are the groups of wells, installed and completed in the mineralized zones that are sized to effectively target delineated mineralization and reach the desired production goals. The mineralized zones are the geological sandstone units where the leaching solutions are injected and recovered via wells in an ISR wellfield and it is bounded between aquitards. The following subsections describe the wellfield design used as the basis for the Project cost estimates included in this PA.
Preliminary Assessment, Lost Creek Property
21.1.1 Proposed Wellfield Design
This PA assumes the patterns for the injection and recovery wells will follow the conventional five-spot pattern consisting of a recovery well surrounded by four injection wells. Depending on the shape of the mineralized zone, other patterns, including seven-spot, line drive or staggered line drive patterns, may also be used. The dimensions of the patterns vary depending on the mineralized zone, the aquifer transmissivity, etc. The preliminary wellfield design developed for this report assumes injection wells will typically be on the corners of a 100-ft square. Costing has been developed assuming this spacing, but may be anywhere between 50 and 120 ft apart. In order to effectively recover the uranium and also to complete the groundwater restoration, the wells will be completed so that they can be used as either injection or recovery wells, allowing flow direction to be reversed at any time during the production or restoration phases of the Project. A slightly greater volume of water will be recovered from the mineralized zone aquifer than injected in order to create a cone of depression or a flow gradient towards the recovery wells.
21.1.2 Wellfield Installation
URE has and the Authors understand that URE intends to continue to perform exploration and delineation drilling in each proposed Resource Area prior to installing the injection and production wells to better define mineral resources for design of mine units. This allows the designing geologist to reasonably know the depth and thickness of the mineralized zone and the depth of the underlying shale prior to specifying the screen interval for the injection and production wells. A wellfield, will consist of patterns of recovery and injection wells (e.g., the pattern area) within a ring of monitor wells to detect horizontal excursions of the water-based leaching solutions away from the mineralized zone. Monitor wells will also be completed in overlying and underlying aquifers as necessary to detect vertical excursions. Inside the pattern area, monitor wells (which may double as production or injection wells) will also be completed in the mineralized zone to provide baseline water quality information prior to the mining process and gauge restoration performance after mining is complete.
Pilot holes for monitor, production, and injection wells will be drilled through the target completion interval. The hole will be logged, reamed, casing set, and cemented to isolate the completion interval from all other aquifers. After underreaming, setting the screen and, possibly, a sand filter pack, the well will be air lifted and swabbed to remove any remaining drilling mud and/or cuttings. The primary goal of this well development is to allow formation water to freely enter the well screen. This process is necessary to allow representative samples of groundwater to be collected, and to ensure efficient injection and recovery operations.
Typical well completion schematics for pattern wells (recovery and injection wells), and monitor wells are shown on Figures 13a, b and c. The monitoring wells will be constructed in the same manner as the injection/recovery wells.
Preliminary Assessment, Lost Creek Property
21.1.3 Mechanical Integrity Testing (MIT)
After an injection, recovery or monitor well has been completed, and before it is made operational, URE will perform a MIT of the well casing. An MIT will also be performed on any injection well that is damaged during operations or has had a drill bit cutting tool inserted in the well. In the integrity test, the bottom of the casing adjacent to or below the confining layer above the zone of interest is sealed as is the top of the casing, and a pressure gauge is installed to monitor the pressure inside the casing. The pressure in the sealed casing is then increased to a specified test pressure and will maintain 95 percent of this pressure for ten minutes to pass the test. If any well casing that fails the test cannot be repaired, the well shall be plugged and abandoned.
In accordance with WDEQ and NRC requirements, MITs will be repeated once every five years for all wells used for injection of lixiviant, or injection of fluids for restoration operations. Results of MIT will be maintained on-site and will be reported, as required to WDEQ.
21.1.4 Production
The proposed uranium ISR process will involve the dissolution of the water-soluble uranium compound from the mineralized host sands at neutral pH ranges and consists of two steps. First, the uranium will be oxidized with an oxidant such as oxygen or hydrogen peroxide. Second, a chemical compound such as carbon dioxide or baking soda (NaHCO3) will be used to complex the uranium in the solution, if needed. The uranium-rich solution (typically 20 mg/l to 250 mg/l, but may be higher or lower) will be transferred from the production wells to the processing facility nearby for uranium concentration with IX resin. Recovery flow rates will always be slightly greater than injection rates.
21.1.5 Development Plan
To plan production, develop extraction schedules, establish baseline data, comply with monitoring requirements and complete restoration, the Authors understand that URE has currently divided the Project into five Resource Areas and 40 header house areas as shown in Figures 12 and 14 and as presented in Table 13. Header houses in Resource Area 1 will be constructed simultaneous to the construction of the Plant. These header houses will be brought on line sequentially (at an anticipated rate of one header house per month) until the nominal Plant throughput (approximately 5,000 to 6,000 gpm) is attained. The remainder of Resource Area 1 and additional areas will be developed in such a way as to allow for Plant capacity to be maintained. In other words, as the productivity or head grade from the initial Resource Area decreases below economic limits, replacement patterns from additional header houses or Resource Areas will be placed into operation in order to maintain the desired flow rate and head grade at the Plant.
Preliminary Assessment, Lost Creek Property
Table 13: Anticipated Resource Development Plan, Lost Creek Project
|
Resource Area
|
Total Pounds
(thousands)
|
Number of Header Houses
|
Patterns
(estimated)
|
Pounds Recoverable
(thousands)
|
Lixiviant Concentration (mg/L)
|
|
RA-1
|
1,760
|
12
|
240
|
1,408
|
42
|
|
RA-2
|
2,420
|
16
|
320
|
1,936
|
42
|
|
RA-3
|
657
|
4
|
80
|
526
|
42
|
|
RA-4
|
731
|
5
|
100
|
585
|
42
|
|
RA-5
|
438
|
3
|
60
|
350
|
42
|
Eventually, all the patterns in a given Resource Area will reach their economic limit and production flow in that area will be terminated. At that time, all production flow will be generated from the next group of header houses or Resource Areas. Estimated sequencing of the header house/wellfield development is described in more detail in Section 21.9.
The development plan is subject to change due to extraction schedules, variations with production area recoveries, Plant issues, economic conditions, etc. Table 14 presents the production schedule assumed in the evaluations in this document.
Table 14: Lost Creek Project Production Schedule
|
Year
|
Production (pounds)
|
|
2012
|
98,800
|
|
2013
|
1,032,100
|
|
2014
|
1,081,000
|
|
2015
|
1,081,000
|
|
2016
|
1,081,000
|
|
2017
|
430,600
|
|
Total
|
4,804,600
|
| |
Note:
|
Uranium production solution grade is assumed to be 42 mg/l over the entire production schedule.
|
21.1.6 Piping System
Pipelines will transport the wellfield solutions to and from the IX columns of the Plant. The flow rates and pressures of the individual well lines will be monitored in the header houses. Flow and pressure of the field production systems will be monitored and controlled as appropriate at the header houses as well. High density polyethylene (HDPE), PVC, stainless steel, or equivalent piping will be used in the wellfields and will be designed and selected to meet design operating conditions.
Preliminary Assessment, Lost Creek Property
The lines from the Plant, header houses, and individual well lines will be buried for freeze protection and to minimize pipe movement. Other ISR mines in Wyoming have successfully buried HDPE pipelines. Figure 14 illustrates the approximate location for trunk lines to/from the wellfields and the Plant.
21.1.7 Header Houses
Header houses will be used to distribute lixiviant injection fluid to injection wells and collect Pregnant Lixiviant Solution (PLS) from recovery wells. Figure 14 identifies approximate header house locations for the Project. Each header house will be connected to two trunk lines, one for receiving barren lixiviant from the Plant and one for conveying PLS fluids to the Plant. The header houses will include manifolds, valves, flow meters, pressure meters, instrumentation and oxygen for incorporation into the injection lixiviant, if and when required.
Each header house will service approximately 60 wells (injection and recovery). Figure 15 illustrates a simplified piping and instrumentation schematic for the header houses. Table 15 presents the current anticipated header house and well summary by Resource Area.
Table 15: Project Header House and Well Inventory by Resource Area
|
Item
|
Resource Areas
|
|
1
|
2
|
3
|
4
|
5
|
|
Header Houses
|
12
|
16
|
4
|
5
|
3
|
|
Injection Wells
|
404
|
562
|
149
|
170
|
102
|
|
Recovery Wells
|
231
|
321
|
85
|
97
|
58
|
|
Interior Monitoring Wells
|
26
|
36
|
18
|
22
|
18
|
|
Perimeter Monitoring Wells
|
28
|
38
|
25
|
23
|
23
|
|
Disposal Wells (2)
|
0
|
0
|
0
|
0
|
0
|
21.1.8 Wellfield Reagents, Electricity and Propane
The evaluation presented in this document assumes, based on the production schedule and plan the use of the following reagents and electricity in the wellfield on an annual basis:
|
Oxygen
|
26.0MM standard cubic ft
|
|
Carbon dioxide
|
467 tons
|
|
Corrosion inhibitor
|
12 barrels
|
|
Electricity
|
11.1MM kilowatt-hours (kWh)
|
Preliminary Assessment, Lost Creek Property
21.2 Processing
The proposed Project Plant will have four major solution circuits: the uranium recovery/extraction circuit (IX); the elution circuit to remove the uranium from the IX resin; a yellowcake precipitation circuit; and the dewatering, drying and packaging circuit. Figure 16 presents a simplified, typical process flow diagram. The system has been designed to recycle and reuse most of the solutions inside each circuit. A low-volume bleed is permanently removed from the water-based leaching solution flow to create a “cone of depression” in the wellfield’s static water level and ensure that the leaching solution in the target mineralized zone is contained by the inward movement of ground water within the designated recovery area. This bleed solution will be routed to DDWs.
Preliminary Assessment, Lost Creek Property
Figure 16
Plant Flow Diagram
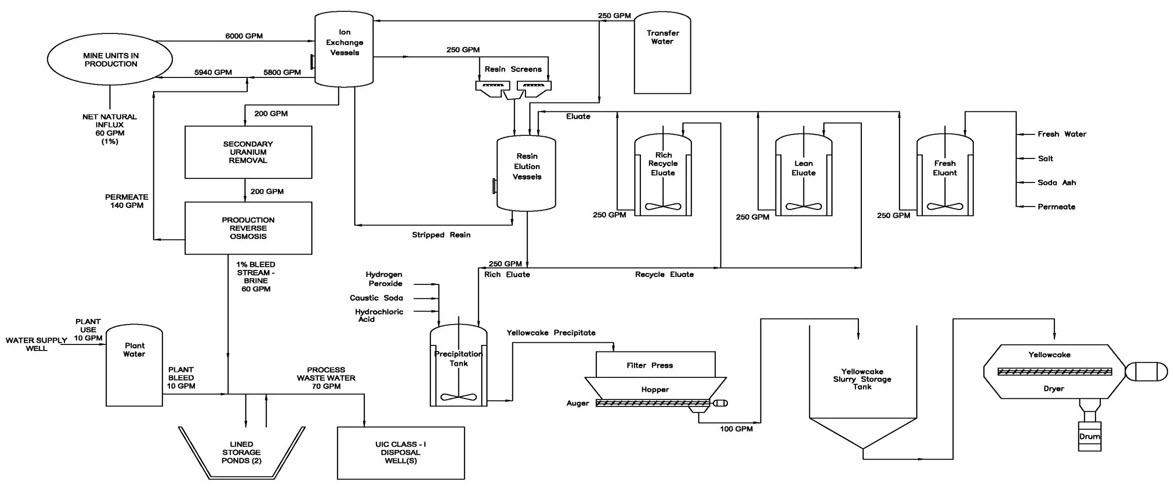
Preliminary Assessment, Lost Creek Property
The Project Plant will house most of the process equipment in an approximate 90-ft-by 260-ft metal building. However, some of the bulk chemical storage tanks will be located in silos or tank storage outside of the process building. The major process components are shown in Figures 14 and 17. The water treatment system (reverse osmosis) used for treating the bleed and for aquifer restoration will also be located in the Plant. As shown on Figure 17, a laboratory/office building and a shop building will also be constructed near the Plant. In addition to office spaces for professional staff and the on-site laboratory, the building will include the computer server room, lunchroom, and restroom/change room facilities. The shop building will contain the warehouse, maintenance shop, the construction shop and the drilling shop with all the required tools/equipment and various supplies for performing maintenance.
As described in Sections 21.2.4 and 21.1.5, PLS from the wellfields will be pumped to Plant for beneficiation as described below:
IX Circuit -- Uranium liberated from the underground deposits in the Resource Areas will be extracted from the solution in the IX circuit. This evaluation assumes an average uranium headgrade of 42 mg/l based on the production model and leach tests. Subsequently, the barren lixiviant will be reconstituted to the proper bicarbonate strength, if needed, prior to being pumped back to the wellfield for reinjection. A low-volume bleed will be permanently removed from the lixiviant flow. The bleed will be treated by reverse osmosis and the permeate is used in the process. Brine and excess bleed will be disposed of by means of injection into an Underground Injection Control (UIC) Class I disposal well (DDW).
Elution Circuit -- When it is fully loaded with uranium, the IX resin will be subject to elution. The elution process will reverse the loading reactions for the IX resin and strip the uranium from the resin. The resulting rich eluate will be an aqueous solution containing salt and sodium carbonate and/or sodium bicarbonate.
Yellowcake Precipitation Circuit -- Yellowcake will be produced from the rich eluate. The eluate from the elution circuit will be de-carbonated in slurry tanks by lowering the pH below two standard units with hydrochloric acid. The yellowcake product will be precipitated with hydrogen peroxide using sodium hydroxide for pH control.
Yellowcake Dewatering, Drying and Packaging Circuit -- The precipitated yellowcake slurry will be transferred to a filter press where excess liquid will be removed. Following a fresh water wash step that will flush any remaining dissolved chlorides, the resulting product cake will be transferred to the yellowcake dryer which will further reduce the moisture content, yielding the final dried free-flowing product. Refined yellowcake will be packaged in 55-gallon steel drums.
Prior to completion of the Plant and initial Resource Area, URE will secure a contract with a uranium hexafluoride processing facility. For the purposes of this PA, it has been assumed that drummed yellowcake will be shipped via truck approximately 1,200 miles to the Honeywell uranium hexafluoride processing facility in Metropolis, Illinois. This conversion facility is the first manufacturing step in converting the yellowcake into reactor fuel.
21.2.1 Plant Reagents, Electricity and Propane
Chemicals that are anticipated to be used in the Plant processes and the assumed annual consumption rates include:
Preliminary Assessment, Lost Creek Property
|
Hydrochloric acid
|
3.9MM lbs/year
|
|
Caustic soda
|
1.0MM lbs/year
|
|
Peroxide
|
0.28MM lbs/year
|
|
Salt
|
7.9MM lbs/year
|
|
Soda ash
|
0.17MM lbs/year
|
|
Resin (make-up/replacement)
|
3,000 cubic ft/year
|
The different types of chemicals will be stored, used and managed so as to ensure worker and environmental safety in accordance with standards developed by regulatory agencies and vendors. The hydrochloric acid and hydrogen peroxide storage areas will include secondary containment. Sodium hydroxide and the various acid and caustic chemicals are of potential concern and will be stored and handled with care. To prevent unintentional releases of hazardous chemicals and limit potential impacts to the public and environment, URE will implement its internal operating procedures consistent with federal, state and local requirements.
Estimates used in the evaluation presented in this document assume the annual consumption of approximately 90,600 gal of propane and 9.47 kWh of electricity to heat and light the Plant and operate the process equipment.
21.2.2 Liquid Disposal (Deep Disposal Well)
Typical ISR mining operations require a disposal well for limited quantities of fluids that cannot be returned to the production aquifers. Five UIC DDW are permitted and one has already been drilled at the Project for disposal of liquid waste. The CAPEX and OPEX estimates for this PA assume that two UIC DDWs will be completed and used for this Project that the maximum volume of liquid wastes at the Plant will be approximately 70 gpm during normal operations and up to 115 gpm during restoration. Because the first DDW has been installed, tested and was used as the basis for permitting of the other four DDW’s, surety of this facet in the mining process is enhanced.
21.2.3 Solid Waste Disposal
Solid wastes will normally consist of spent resin, empty packaging, miscellaneous pipes and fittings, tank sediments, used personal protective equipment and domestic trash. These materials will be classified as contaminated or non-contaminated based on their radiological characteristics.
Non-contaminated solid waste is waste which is not contaminated with radioactive material or which can be decontaminated and re-classified as non-contaminated waste. This type of waste may include trash, piping, valves, instrumentation, equipment and any other items which are not contaminated or which may be successfully decontaminated. Current estimates are that the site will produce approximately 625 cubic yards of non-contaminated solid waste per year. Non-contaminated solid waste will be collected in designated areas at the Project site and disposed of in the nearest permitted sanitary landfill.
Contaminated solid waste consists of solid waste contaminated with radioactive material and that cannot be decontaminated. This waste will be classified as 11e.(2) byproduct material. This byproduct material will consist of filters, personal protective equipment, spent resin, piping, etc. These materials will be temporarily stored on-site and periodically transported for disposal. URE will establish an agreement for disposal of this waste as 11e.(2) byproduct material in a licensed waste disposal site or licensed mill tailings facility.
Preliminary Assessment, Lost Creek Property
It is estimated that the site will produce approximately 90 cubic yards of 11e.(2) byproduct material as waste per year. This estimate is based on the waste generation rates of similar in situ uranium recovery facilities.
21.3 Site Human Resources
URE has evaluated and has provided the Authors with manpower estimates for the Project. The Authors have reviewed and concurs with those estimates, presented as summaries below and in detail in Sections 21.5 and 21.6, are used in this PA for the purposes of calculating CAPEX and OPEX costs. URE will construct the Project wellfields using its own crews. Detailed construction staff composition is presented in Section 21.5. The personnel required to complete pre-construction activities is anticipated to consist of 24 staff. URE will contract the construction of the Plant and provide a construction manager/engineer to oversee the construction.
During operations, current manpower estimates for the Project with a Plant facility during the operating phase assumes a total of 59 staff (seven management, five EHS, six geology, 14 construction, six maintenance, 20 operations and one engineer). Detailed operations staff composition is presented in Section 21.6. Operations staff will consist of four crews operating two, 12-hour shifts per day, seven days per week. Crews will alternate such that two crews are on for four days (one each for the day shift and the night shift) and two crews are off.
21.4 Taxes, Rents and Royalties
Project related taxation in Wyoming consists of a severance tax payable to the state plus ad valorem and personal property taxes payable to Sweetwater County. There are also state and county sales/use taxes.
The basis for both the state severance tax and the county ad valorem tax is the taxable value of product sold from the mine. Taxable value is computed by:
|
|
(a)
|
Taking the net sales value attributable to production from the mine before processing (total sales less production taxes and royalties) times an industry factor established by the state,
|
|
|
(b)
|
Adding back total production taxes1 and private royalties,
|
|
|
(c)
|
Dividing the resultant number by the pounds sold, and
|
|
|
(d)
|
Multiplying this factor by the pounds produced.
|
1This can be either what was paid for the prior year or an iteration calculation
The current industry factor is 0.548827. Since significant value is added to the product produced from the mine during the processing and drying phase of the operations, the industry factor is an attempt to properly allocate the portion of the value of yellowcake sold attributable to the Project back to the Project, the point the mineral was severed.
Preliminary Assessment, Lost Creek Property
The state severance tax is calculated at four percent of the taxable value. The county ad valorem tax is computed on the taxable value multiplied by the county mill levy. The 2010 mill levy in Sweetwater County is 63.884 per thousand dollar of assessed value. Using the current industry factor and mill levy, the combined state severance and county ad valorem is approximately 6.4 percent of net sales.
The assessed value (taxable value) of real and personal property taxes, other than the ad valorem taxes described above, is calculated by multiplying the fair market value of the property (based on depreciated values) times the rate of 11.5 percent for industrial property and 9.5 percent for other property. The county mill levy rate is then multiplied by the assessed value to determine the property taxes. Using the current mill levy and an 11.5 percent assessment factor, county property taxes are approximately 0.75 percent of the fair market value.
Wyoming has a four percent sales/use tax and each county has the authority to assess additional sales taxes up to two percent. The combined current sales/use tax for the state and Sweetwater County is five percent.
This evaluation ignores the effect of federal and state income taxes. LC at present is a single member limited liability company and is treated as a disregarded entity for federal income tax purposes. All of its taxable income and loss is included in the federal tax return for URE. Based on the terms of the sales agreements covering the sale of yellowcake, URE might be subject to state income taxes in the state where the title to the yellowcake transfers.
As currently defined by exploration and development activities to date, all Resource Areas at the Project underlie federal lode mining claims. The Project has a 1.67 percent yellowcake sales royalty on 20 lode mining claims (TONY Claims) of the total 201 federal unpatented lode mining claims. The TONY claims cover parts of Resource Areas Nos. 1, 2 and 4.
If future production comes from the State of Wyoming lease at the Project, it is anticipated that a royalty of three to five percent on the weighted average price for yellowcake based on gross yearly sales realization will be payable.
Annual maintenance fees to be paid to the BLM for the federal lode claims at the Project are presently $28,140/year. Yearly fees for the 640-acre State of Wyoming lease (Section 16, T25N, R92W) are currently $1,280/year. Additional yearly payments are made to the State for a Surface Impact Payment of $2/acre of which the State gives a percentage to the surface grazing rights lessee.
21.5 Capital Cost Estimation (CAPEX)
The following sections provide a summary of the quantities and assumptions used to develop the CAPEX costs for the Resource Areas and the Plant. Table 16 provides a summary of the CAPEX costs for the Plant and wellfields. Total CAPEX costs of Plant and wellfields have been estimated at $35.06 million including pre-production costs of $7.84 million and capitalized initial wellfield costs of $5.62 million.
Preliminary Assessment, Lost Creek Property
Table 16: Development and CAPEX Cost Summary, Lost Creek Property
|
Plant Costs
|
|
|
|
|
|
Item Description
|
|
Cost
|
|
Comments
|
|
Personnel Costs - Plant Construction/Start-up
|
|
$ |
0 |
|
Included in Personnel Costs
|
|
Tanks, Pumps, Filters, Piping, Valves, Fittings
|
|
$ |
6,049,681 |
|
Includes first fill on chemicals
|
|
Yellowcake Precipitation & Drying
|
|
$ |
915,091 |
|
Includes Precip tanks, filter press, drying equip
|
|
Buildings, site infrastructure
|
|
$ |
7,456,273 |
|
Includes office equipment, fencing, etc.
|
|
Engineering and Installation
|
|
$ |
1,310,743 |
|
|
|
Reverse Osmosis
|
|
$ |
1,785,985 |
|
|
| |
|
|
|
|
|
|
Plant Total
|
|
$ |
17,467,528 |
|
Includes 10% contingency
|
| |
|
|
|
|
|
| |
|
|
|
|
|
|
Deep Disposal Wells (2)
|
|
$ |
4,125,000 |
|
Includes 10% contingency
|
|
Wellfield Development Costs
|
|
Item Description
|
|
Cost
|
|
Comments
|
|
Wellfield Total
|
|
$ |
51,082,892 |
|
Includes injection, recovery & monitoring wells, piping, power cable, header houses.
|
|
MIT failures
|
|
$ |
0 |
|
Included in Wellfield total
|
|
Other Misc. Capital Expenses
|
|
$ |
0 |
|
Included in Wellfield total
|
| |
|
|
|
|
|
|
Personnel
|
|
$ |
0 |
|
Included in Pre-Production Costs
|
|
Process & Instrumentation design and equipment
|
|
$ |
0 |
|
Included in Header House Costs
|
|
Well Field Total
|
|
$ |
56,191,182 |
|
Includes 10% contingency
|
|
Pre-Production Cost
|
|
$ |
7,844,157 |
|
|
|
Initial Wellfield Construction
|
|
$ |
5,619,118 |
|
10% of Wellfield total (4 of 40 headerhouses)
|
|
Total Capital Cost
|
|
$ |
35,055,803 |
|
|
The predicted level of accuracy of the CAPEX estimate is +/- 15 percent. The budget prices for the major items identified in this study have been sourced in the United States.
Pre-production costs reported by URE have been evaluated by the Authors and included in the CAPEX estimate. Pre-production includes costs for some engineering and drilling work, but most pre-production costs have already been incurred, and therefore are considered as sunk costs, and not included in this study. Table 1 summarizes the pre-production costs.
The CAPEX costs developed for and presented in this PA are based on typical uranium ISR wellfield designs and the substantially complete Plant design and bid and purchase order pricing from URE. The Plant designs are at the “issue-for-bid” and/or “accepted” level. URE has received bids for the Project Plant equipment and buildings. The design includes process flow diagrams, water balance, materials balance, chemical consumption estimates, tank sizes, and specific processing circuit components (i.e., type of filter press, dryer, etc.). Line sizing, material types, pumps, valves and instrumentation have been identified and priced. In addition, the wellfield design used for this PA includes estimated well and header house locations, well depths, construction materials and anticipated flow rates. TREC and URE developed a preliminary design for the hydraulic conveyance system associated with the wellfields including the pipeline length, material and sizing, trenching requirements and other components.
Preliminary Assessment, Lost Creek Property
Vendor and recent bid pricing has been obtained for mechanical equipment and compared with TREC cost information to develop accurate cost information. Material takeoffs and contractor/vendor prices and historical costs have been used to estimate piping, wells, header houses, process equipment, structural, earthwork, electrical and other costs. The level of design for the Project combined with URE’s extensive efforts to attain vendor bids for costs for system components, many validated based on recent bid estimates for other ISR projects, provides confidence in the CAPEX cost estimates.
To facilitate the development of CAPEX cost estimates, TREC developed the following from URE’s purchase order and construction bids/contracts and similar projects for which TREC has provided Plant designs:
|
|
·
|
Mechanical equipment requirements,
|
|
|
·
|
Plant design and equipment takeoffs,
|
|
|
·
|
Chemical types and consumption rates,
|
|
|
·
|
Well details and depths,
|
|
|
·
|
Wellfield layout (injection, recovery and monitoring well locations), and
|
|
|
·
|
Anticipated well production rates.
|
The CAPEX cost estimates were built up using a series of detailed estimating spreadsheets including:
|
|
·
|
Injection, recovery and monitoring well estimating sheets,
|
|
|
·
|
Header house estimating sheets,
|
|
|
·
|
Wellfield piping, electrical cable and trenching estimating sheets,
|
|
|
·
|
Mechanical equipment list,
|
|
|
·
|
Vendor estimates for mechanical equipment and structures, and
|
|
|
·
|
Miscellaneous capital equipment (i.e., light vehicles, support and maintenance vehicles).
|
|
|
·
|
Cost estimating spreadsheets are summarized in Tables 1 and 2.
|
21.5.1 Wellfields
The Project includes five Resource Areas for the in situ recovery of uranium from the mineralized zones (See Figures 12 and 14). Figure 14 presents locations of the various wellfield components.
Resource Area 1 will be the first area constructed and has been considered a CAPEX cost, as a large portion of the area will be completed prior to production. During the initial construction of the wellfields and Plant, it is assumed that approximately 24 URE staff will be required to construct and manage the work. The following initial manpower requirements are anticipated and were used in the CAPEX cost estimates.
Preliminary Assessment, Lost Creek Property
|
Staff/Position
|
No.
|
|
Environmental, Health and Safety
Project Engineer
Site Chief and Staff Geologists
|
2
1
4
|
|
Logging Truck Operator
|
2
|
|
Casing/Cement Technician
|
5
|
|
Instrumentation Techs
Drilling Supervisor
|
2
1
|
|
Construction Foreman
|
1
|
|
Construction Crew
|
5
|
|
Electrician
|
1
|
|
Total
|
24
|
Salaries and labor burden used for this PA are based on estimates and typical wages for this type of work in Wyoming and burdens that include workers compensation, vacation, holidays, taxes, and employee benefits.
The current Project schedule anticipates that pre-production construction will occur in 2012 and the remaining Resource Areas will be developed and constructed in Project 2012 through 2016. It is assumed that the costs for construction of Resource Areas 2 through 5 will be expensed as an OPEX cost. The remaining wellfield costs are discussed in Section 21.6.7.
Non-labor construction costs were estimated based on the preliminary wellfield design including the number, location, depth and construction material specifications for well and header houses. URE has performed a preliminary design of the hydraulic conveyance (piping) system associated with the wellfield that has been reviewed by the Authors. Quantity takeoffs and vendor pricing were used to develop the detailed cost estimates. Installation costs were determined from vendor/contractor quotes and labor and equipment rates and production estimates. Costs for MIT, as described in Section 21.1.3 is also included for Resource Areas 2 through 5.
The first Resource Area was designed to consist of:
404 injection wells,
26 vertical monitor wells,
28 horizontal monitor wells, and
12 header houses.
Additionally, costs for associated trunk and feeder pipelines, electrical service and wellfield fencing is included.
21.5.2 Processing Plant
The proposed location of the Plant is shown on Figure 14 and the Plant layout is depicted on Figure 17. URE anticipates contracting the construction of the Plant to a third party and will provide one construction manager/engineer to oversee and verify Plant construction. Most of the process equipment will be housed in a metal building as described in Section 21.2. Installation costs were estimated by trade; i.e., electrical, pipe fitters, instrumentation, structural, etc.
Preliminary Assessment, Lost Creek Property
A two-story office and laboratory building and a shop building will be located north of the Plant, as shown on Figure 17.
21.5.3 Process Plant Piping
Piping will be required between the various processing units and bulk storage tanks. Estimates for pipe length and material type were developed based on the Plant design. The final design for the Plant is at the issued-for-bid stage and some components being bid at the time of this report.
21.5.4 Earthwork and Topsoil Management
Earthwork that will be required for the Project will include site grading for the Plant/office, shops building area, internal access roads and excavation and backfill for header houses, buried piping and electrical service. No upgrading is expected for access roads from Bairoil, Wamsutter, Rawlins or Jeffrey City, Wyoming. Injection and recovery pipelines will be buried a minimum of 48 inches below the existing ground surface and each header house will have a sump and foundation walls below the structure.
Topsoil will be salvaged from any disturbed areas prior to construction in accordance with WDEQ/LQD requirements using common earth moving equipment. Topsoil salvage operations for the wellfield will be limited to the removal of topsoil at header house locations, pipeline trench alignments and separation of topsoil from mud pits at drill sites. Topsoil that is salvaged during construction activities will be stored in designated topsoil stockpiles and managed per regulatory requirements.
21.5.5 Concrete
Concrete will be used for foundations below all structures and flatwork within the Plant. Thickened slabs/isolated tank foundations will be used to support all processing equipment. Some processing circuits will also be contained by curbing in the concrete floor slab with drainage to a sump for spill containment and recovery. All chemical storage tanks will include containment and recovery systems built into the concrete floor slab.
21.5.6 Structural Steelwork
Structural steelwork includes the frame and skins for the Plant, maintenance building, office/laboratory building, resin shakers, filter press and dryer support. Estimates have been prepared from the Plant layout design and preliminary vendor building designs and pricing.
21.5.7 Electrical and Instrumentation
Overhead electrical is located within approximately 1-1/2 miles from the Project buildings. Power drops will be distributed to the Plant, office, maintenance/warehouse building, wellfields, etc. One 350-KW diesel generator is included in the CAPEX for back-up power for vital functions within the Plant. Power supply, consumption and distribution quantities and costs are included in the cost estimates for the various Project components. The cost estimates assume that electrical capacity is available in the regional electrical utility’s system.
Wellfield instrumentation designs had not been completed at the time this PA was prepared. Therefore, instrumentation and control costs have been estimated based on providing an automated system to monitor operations at a central location such as the Project Plant.
Preliminary Assessment, Lost Creek Property
For the wellfield CAPEX cost estimate the following instrumentation was assumed and costs developed:
Wellfields -
|
|
·
|
Pressure gages for injection and recovery feeder lines,
|
|
|
·
|
Flow meters for injection and recovery feeder lines,
|
|
|
·
|
Manual/automated shut off, flow control and check valves,
|
|
|
·
|
Oxygen Rota-meters and feeder line shut-off capability, and
|
|
|
·
|
SCADA and telemetric monitoring and controls.
|
Plant –
|
|
·
|
Liquid level transducers,
|
|
|
·
|
Automatic shut off valves,
|
|
|
·
|
Automated chemical feed controls, and
|
|
|
·
|
SCADA monitoring and control.
|
21.5.8 Infrastructure and Facilities
21.5.8.1 Sanitary Sewer
Two septic systems will be used for sanitary sewage disposal. See Figure 17 for locations. The system will be for treatment/disposal of sanitary waste from the Plant, office and maintenance buildings. All other wastewater generated from within the Plant will be disposed of via the DDWs.
21.5.8.2 Fresh Water Well
The Project facilities will require fresh water for showers and other domestic uses as well as for Plant wash down and yellowcake wash. One fresh-water well has been installed. The well depth is 985 ft and located near the Plant. The well includes a five-horsepower pump.
21.5.8.3 Roadwork and Site Drainage
There are four types of roads that will be used for access to the Project. They include primary access roads, secondary access roads, temporary wellfield access roads, and well access roads. Access to the Project is via Sweetwater County Road 23 or the Sooner Road. Figures 1 and 2 show the major access roads to the Project.
Primary access roads will be used for routine access to the main processing facility at the Project. Two-track roads currently serve as site access. URE will construct or improve approximately 50,000 ft of new road to serve as Project access.
There are only minor drainage paths across the primary access roads. The costs for culverts are included in the road construction estimate. The new construction will typically be a 20-ft-wide, gravel surface. Snow removal and periodic surface maintenance will be required.
Preliminary Assessment, Lost Creek Property
The secondary access roads will be used at the Project to provide access to the wellfield header houses. The secondary access roads will be constructed with limited cut and fill construction and may be surfaced with small sized aggregate or other appropriate material.
The temporary wellfield access roads are for access to drilling sites, wellfield development, or ancillary areas assisting in wellfield development. URE will use when possible existing two-track trails or designate two-track trails where the land surface is not typically modified to accommodate the road. The temporary wellfield access roads will be used throughout the mining areas.
21.5.8.4 Communications
Primary communications will be by a microwave tower (already installed). In addition, both Plant and wellfield personnel will be equipped with hand-held and truck-mounted radios for on-site communications.
21.5.8.5 Laboratory Equipment
Laboratory equipment will consist of ICP for uranium and metals analyses, an auto-titrator for alkalinity and chloride measurements, specific conductance meter and other equipment, materials and supplies required to efficiently operate the mine and Plant. In addition the laboratory will require fume hoods, reagent storage cabinets and other safety equipment. Costs for laboratory equipment, supplies and set-up have been included in the Plant CAPEX calculations.
21.5.8.6 Deep Disposal Wells
Five DDWs are permitted and two are planned for construction at the Project and priced for this PA. The well(s) are anticipated to be up to 10,000 ft deep. As required by an existing WDEQ permit, the DDWs will be completed in approved formations. One of the DDWs (located in Section 25) has been drilled, cased and the proposed formations tested. Upon receipt of the appropriate permits, the first well will be outfitted with an injection string and pump and the second well will be installed.
21.5.8.7 Vehicles and Miscellaneous
Several pieces of equipment including light duty trucks have been purchased prior to the writing of this report. Other vehicles and equipment that will be purchased include:
|
Item
|
No.
|
|
Pick-up Trucks
|
0
|
|
Hose-reel Units
|
2
|
|
Pulling Unit
|
1
|
|
Nurse Trailer
|
2
|
|
Portable Air Compressor
|
1
|
|
Logging Truck
|
1
|
|
AWD Forklift
|
3
|
|
Backhoe
|
2
|
|
Farm Tractor/Implements
|
1
|
|
Motor Grader
|
1
|
|
Tool sets
|
20
|
|
Welder
|
2
|
|
End Dump Trailer
|
1
|
|
HDPE Fusion Equipment
|
1 Lot
|
Preliminary Assessment, Lost Creek Property
21.5.8.8 Security
Due to the remote location of the facilities and continuous operation, manned security is not anticipated to be necessary. The Plant, along with auxiliary buildings, is anticipated to be enclosed by a BLM-approved fence. In addition, typical operations will be 24 hours per day and seven days per week. URE personnel will be on-site continuously.
21.5.9 EPCM and Expenses
Engineering, procurement and construction management (EPCM) services will be performed partially with in-house staff and partially with contractors or completely with contracted services. The CAPEX estimate assumes a URE construction staff of 24, working on the Plant construction and wellfield construction.
21.5.10 Contingency
A ten percent contingency has been added to all costs.
21.5.11 Owner’s Costs
URE will provide overall project management and EPCM services for Plant construction. It is anticipated that this will require one construction manager/engineer, as described in Section 21.5.2. Additionally, URE will provide the crews to construct wellfield components including well logging, MIT testing, geological interpretation, wellhead and header house construction and trenching and pipeline construction as described in Section 21.5.1.1. Additional URE costs include working capital for salaries and capital procurement and general administrative and overhead. These costs are included in the CAPEX labor estimate.
21.6 Operating Cost Estimation (OPEX)
21.6.1 OPEX Allocation and Methodology
The OPEX costs have been developed by evaluating each process unit operation and the associated required services (power, water, air, waste disposal), infrastructure (offices, change rooms shop), salary and burden, and environmental control (heat, air conditioning, monitoring). In addition, OPEX costs also include construction of a portion of Resource Area 1 and Resource Areas 2 through 5 in 2012 through 2016. The basis for the OPEX estimate is the development plan based on design wellfield flows and head grade, process flow-sheets, preliminary process design, materials balance and Project manpower schedule. The Annual OPEX and the Closure Cost Summary for the Plant are provided in Table 17. Total OPEX costs have been estimated at $94.44 million including closure costs of $21.15 million.
The predicted level of accuracy of the OPEX and Closure estimates are approximately +/- 15 percent. The prices for the major items identified in this PA have been sourced in the United States.
Preliminary Assessment, Lost Creek Property
Table 17: Annual Operating Costs (OPEX) Summary, Lost Creek Property
|
Life of Mine Operation Costs
|
|
Year -1 (2011)
|
|
|
Year 1 (2012)
|
|
|
Year 2 (2013)
|
|
|
Year 3 (2014)
|
|
|
Year 4 (2015)
|
|
|
Year 5 (2016)
|
|
|
Year 6 (2017)
|
|
|
Year 7 (2018)
|
|
|
Year 8 (2019)
|
|
|
Year 9 (2020)
|
|
|
Year 10 (2021)
|
|
|
Year 11 (2022)
|
|
|
Year 12 (2023)
|
|
|
Total
|
|
|
Cost per LB
|
|
|
Description
|
|
|
|
|
|
|
|
|
|
|
|
|
|
|
|
|
|
|
|
|
|
|
|
|
|
|
|
|
|
|
|
|
|
|
|
|
|
|
|
|
|
|
|
|
4,804,600 |
|
|
Salaries and Wages (Plant)
|
|
$ |
0 |
|
|
$ |
546,721 |
|
|
$ |
2,186,884 |
|
|
$ |
2,186,884 |
|
|
$ |
2,186,884 |
|
|
$ |
2,186,884 |
|
|
$ |
1,749,507 |
|
|
$ |
1,312,130 |
|
|
$ |
874,754 |
|
|
$ |
874,754 |
|
|
$ |
437,377 |
|
|
$ |
218,688 |
|
|
$ |
0 |
|
|
$ |
14,761,467 |
|
|
$ |
3.38 |
|
|
Salaries and Wages (Wellfield)
|
|
$ |
0 |
|
|
$ |
463,820 |
|
|
$ |
1,855,280 |
|
|
$ |
1,855,280 |
|
|
$ |
1,855,280 |
|
|
$ |
1,855,280 |
|
|
$ |
1,484,224 |
|
|
$ |
1,113,168 |
|
|
$ |
742,112 |
|
|
$ |
742,112 |
|
|
$ |
371,056 |
|
|
$ |
185,528 |
|
|
$ |
0 |
|
|
$ |
12,523,140 |
|
|
$ |
2.87 |
|
|
Wellfield Costs (excludes closure related)
|
|
$ |
0 |
|
|
$ |
687,641 |
|
|
$ |
2,750,566 |
|
|
$ |
2,750,566 |
|
|
$ |
2,750,566 |
|
|
$ |
2,750,566 |
|
|
$ |
2,750,566 |
|
|
$ |
2,200,452 |
|
|
$ |
1,650,339 |
|
|
$ |
1,100,226 |
|
|
$ |
0 |
|
|
$ |
0 |
|
|
$ |
0 |
|
|
$ |
19,391,487 |
|
|
$ |
4.44 |
|
|
Processing Plant Costs (excludes closure related)
|
|
$ |
0 |
|
|
$ |
402,080 |
|
|
$ |
1,608,321 |
|
|
$ |
1,608,321 |
|
|
$ |
1,608,321 |
|
|
$ |
1,608,321 |
|
|
$ |
1,286,657 |
|
|
$ |
964,993 |
|
|
$ |
643,329 |
|
|
$ |
482,496 |
|
|
$ |
0 |
|
|
$ |
0 |
|
|
$ |
0 |
|
|
$ |
10,212,841 |
|
|
$ |
2.34 |
|
|
Plant Power Costs (excludes closure related) (7)
|
|
$ |
0 |
|
|
$ |
235,625 |
|
|
$ |
942,500 |
|
|
$ |
942,500 |
|
|
$ |
942,500 |
|
|
$ |
942,500 |
|
|
$ |
754,000 |
|
|
$ |
565,500 |
|
|
$ |
377,000 |
|
|
$ |
282,750 |
|
|
$ |
0 |
|
|
$ |
0 |
|
|
$ |
0 |
|
|
$ |
5,984,876 |
|
|
$ |
1.37 |
|
|
Product Shipping Costs
|
|
$ |
0 |
|
|
$ |
3,121 |
|
|
$ |
130,370 |
|
|
$ |
136,552 |
|
|
$ |
136,552 |
|
|
$ |
136,552 |
|
|
$ |
54,388 |
|
|
$ |
0 |
|
|
$ |
0 |
|
|
$ |
0 |
|
|
$ |
0 |
|
|
$ |
0 |
|
|
$ |
0 |
|
|
$ |
597,534 |
|
|
$ |
0.14 |
|
|
BLM & State Land Holding & Surface Impact Cost (4)
|
|
$ |
0.0 |
|
|
$ |
29,740.0 |
|
|
$ |
30,700.0 |
|
|
$ |
30,700.0 |
|
|
$ |
30,700.0 |
|
|
$ |
30,700.0 |
|
|
$ |
30,700.0 |
|
|
$ |
30,700.0 |
|
|
$ |
30,700.0 |
|
|
$ |
30,700.0 |
|
|
$ |
30,700.0 |
|
|
$ |
30,700.0 |
|
|
$ |
0.0 |
|
|
$ |
336,740 |
|
|
$ |
0.08 |
|
|
NRC Fees (5)
|
|
$ |
0 |
|
|
$ |
435,320 |
|
|
$ |
125,320 |
|
|
$ |
125,320 |
|
|
$ |
125,320 |
|
|
$ |
94,320 |
|
|
$ |
94,320 |
|
|
$ |
94,320 |
|
|
$ |
94,320 |
|
|
$ |
94,320 |
|
|
$ |
94,320 |
|
|
$ |
94,320 |
|
|
$ |
0 |
|
|
$ |
1,471,520 |
|
|
$ |
0.34 |
|
|
Insurance and Bonding
|
|
$ |
0 |
|
|
$ |
6,338,779 |
|
|
$ |
6,665,028 |
|
|
$ |
3,285,046 |
|
|
$ |
1,595,055 |
|
|
$ |
3,235,340 |
|
|
$ |
-111,505 |
|
|
$ |
-111,505 |
|
|
$ |
-5,082,066 |
|
|
$ |
-61,799 |
|
|
$ |
-8,346,068 |
|
|
$ |
-7,874,589 |
|
|
$ |
0 |
|
|
$ |
-468,285 |
|
|
$ |
-0.11 |
|
|
Subtotal:
(10% contingency added to subtotal)
|
|
$ |
0 |
|
|
$ |
10,057,133 |
|
|
$ |
17,924,466 |
|
|
$ |
14,213,286 |
|
|
$ |
12,354,296 |
|
|
$ |
14,124,510 |
|
|
$ |
8,902,143 |
|
|
$ |
6,786,735 |
|
|
$ |
-736,464 |
|
|
$ |
3,900,115 |
|
|
$- |
8,153,877 |
|
|
$- |
8,079,888 |
|
|
$ |
0 |
|
|
$ |
71,292,453 |
|
|
|
|
|
|
Closure Costs - less Wages
|
|
$ |
0 |
|
|
$ |
0 |
|
|
$ |
1,057,523 |
|
|
$ |
1,057,523 |
|
|
$ |
1,057,523 |
|
|
$ |
1,057,523 |
|
|
$ |
1,057,523 |
|
|
$ |
1,057,523 |
|
|
$ |
2,115,046 |
|
|
$ |
2,115,046 |
|
|
$ |
4,230,093 |
|
|
$ |
5,287,616 |
|
|
$ |
1,057,523 |
|
|
$ |
21,150,464 |
|
|
$ |
4.40 |
|
|
Home Office Support and Allocated Overhead
|
|
$ |
175,000 |
|
|
$ |
175,000 |
|
|
$ |
175,000 |
|
|
$ |
175,000 |
|
|
$ |
175,000 |
|
|
$ |
175,000 |
|
|
$ |
175,000 |
|
|
$ |
175,000 |
|
|
$ |
175,000 |
|
|
$ |
175,000 |
|
|
$ |
175,000 |
|
|
$ |
75,000 |
|
|
$ |
0 |
|
|
$ |
2,000,000 |
|
|
$ |
0.42 |
|
|
Subtotal:
|
|
$ |
175,000 |
|
|
$ |
175,000 |
|
|
$ |
1,232,523 |
|
|
$ |
1,232,523 |
|
|
$ |
1,232,523 |
|
|
$ |
1,232,523 |
|
|
$ |
1,232,523 |
|
|
$ |
1,232,523 |
|
|
$ |
2,290,046 |
|
|
$ |
2,290,046 |
|
|
$ |
4,405,093 |
|
|
$ |
5,362,616 |
|
|
$ |
1,057,523 |
|
|
$ |
23,150,464 |
|
|
|
|
|
|
TOTAL
|
|
$ |
175,000 |
|
|
$ |
10,232,133 |
|
|
$ |
19,156,989 |
|
|
$ |
15,445,809 |
|
|
$ |
13,586,819 |
|
|
$ |
15,357,033 |
|
|
$ |
10,134,666 |
|
|
$ |
8,019,258 |
|
|
$ |
1,553,582 |
|
|
$ |
6,190,162 |
|
|
$- |
3,748,784 |
|
|
$- |
2,717,272 |
|
|
$ |
1,057,523 |
|
|
$ |
94,442,917 |
|
|
$ |
19.66 |
|
|
|
Notes:
|
1.
|
Plant and Wellfield Capex is in Year -1 (2011). Wellfield development is in years -1, 1, 2, 3, & 4 (2011 thru 2015).
|
|
|
2.
|
Costs include 10% contingency
|
|
|
3.
|
Closure costs assume no salvage value for materials and equipment
|
|
|
4.
|
BLM land holding cost is an annual assessment of $140 on each of claim (201 total). State fees include $1,280 annual lease plus surface impact of $2/acre
|
|
|
5.
|
NRC annual fees include $8,320 for Annual Inspections, $50K for NRC Project Manager, $36K for License fees. Dryer Amendment, KM Amendment in Year 2012. Mine Unit Reviews in Years 2012, 2013, 2014, and 2015.
|
|
|
6.
|
Shipping costs are calculated with 19 ton shipments, $4.00/mile and 1,200 miles to the conversion facility
|
|
|
7.
|
Power in Year -1 estimated for construction use
|
Preliminary Assessment, Lost Creek Property
21.6.2 Salaries and Wages
The anticipated staffing requirements were previously summarized in Section 21.3 and include a total staff of 59 people (including wellfield construction personnel). The manpower estimate does not include home and corporate office staff. The salaries and labor burden are based on typical wages for this type of work in Wyoming and burdens that include workers compensation, vacation, holidays, taxes, and other employee benefits.
The anticipated site staff will consist of:
|
Position
|
Category
|
No.
|
|
Mine Manager
|
Mgmt
|
1
|
|
Supervisor IT-Admin
|
Mgmt
|
1
|
|
Accountant
|
Mgmt
|
1
|
|
Technician Instrument
|
Mgmt
|
1
|
|
Technician IT
|
Mgmt
|
1
|
|
Secretary
|
Mgmt
|
1
|
|
Warehouseman
|
Mgmt
|
1
|
|
Supervisor EHS
|
EHS
|
1
|
|
Technician EHS
|
EHS
|
1
|
|
Sampler EHS
|
EHS
|
3
|
|
Site Chief Geologist
|
Geol
|
1
|
|
Supervisor Drilling
|
Geol
|
1
|
|
Staff Geologist
|
Geol
|
3
|
|
Draftsman
|
Geol
|
1
|
|
Backhoe Operator
|
Geol
|
1
|
|
Casing Tech
|
Geol
|
4
|
|
Geotech Logger
|
Geol
|
2
|
|
Project Engineer
|
Eng
|
1
|
|
Foreman WFC
|
Eng
|
1
|
|
Electrician WFC
|
Eng
|
1
|
|
Lead Tech WFC
|
Eng
|
1
|
|
Technician WFC
|
Eng
|
4
|
|
Foreman Maint
|
Eng
|
1
|
|
Technician Maint
|
Eng
|
4
|
|
Electrician Maint
|
Eng
|
1
|
|
Manager Operations
|
Ops
|
1
|
|
Foreman Operations
|
Ops
|
1
|
|
Wellfield Operator
|
Ops
|
5
|
|
Technician WF Maint
|
Ops
|
3
|
|
Foreman Plant
|
Ops
|
1
|
|
Plant Operator
|
Ops
|
5
|
|
Dryer Operator
|
Ops
|
1
|
|
Lab Chemist
|
Ops
|
1
|
|
Technician Lab
|
Ops
|
2
|
| |
|
|
| |
|
Total = 59 |
21.6.3 Consultants
The use of consultants during operations is anticipated to be minimal. Potential services that could be required include data management, compliance issues (i.e., lixiviant excursions detected in monitoring wells), routine monitoring, Plant and/or wellfield optimization and public relations.
Preliminary Assessment, Lost Creek Property
21.6.4 Office, Site and Administrative Costs
Administrative costs for the site office include office consumables, rent, travel and entertainment, regulatory agency interaction, interest expense, postage, communications, office equipment repairs and training. Salaries and capital purchases are included in other categories as described herein.
21.6.5 Insurance
Insurance in addition to that required for staffing (i.e., health, workers compensation, unemployment) will be required. This PA assumes insurance requirements including general liability, automobile and structural (fire and weather damage).
21.6.6 Taxes, Leases, Fees and Royalties
Various taxes, leases, maintenance, land impact and access fees are required and included in the OPEX cost estimates and financial evaluation of this PA. These items were described in detail in Section 21.4.
Resources associated with the TONY claims have been estimated by overlaying the claim boundaries onto the GT contours, and through GIS software analysis, the resources directly below the affected claims have been estimated at approximately 1.37 million pounds. This has been further broken down, as the TONY claims fall into three different Resource Areas (Nos. 1, 2 and 4). The royalty value associated with these resources has been allocated in the cash flow model during the years these resources are estimated to be mined.
21.6.7 Wellfield Operating Costs
Non-labor wellfield operating costs include recovery well pump servicing, repair and replacement; pipeline repair; power; well rehabilitation; MIT; header house maintenance; fence repair; and well access maintenance. In addition, part of Resource Area 1 and Resource Areas 2 through 5 will be constructed largely in Project Years 2012 through 2016 and the costs will be expensed as shown in Tables S-1 and S-2. The cost estimate approach for construction of those Resource Areas is described below.
URE will provide the wellfield construction personnel for construction of header houses and wellfield components for the various Resource Areas. The same crew described in Section 21.5.1.1 for the construction of Resource Area 1 is anticipated for construction of the remaining Resource Areas.
Non-labor costs for construction of these Resource Areas were estimated based on the preliminary wellfield design including the number, location, depth and construction material specifications for wells and header houses and the hydraulic conveyance (piping) system associated with the wellfield. Subsequently, quantity takeoffs and vendor pricing for pipe, well casing, pumps, power cable, valves, meters, etc. were used to develop the detailed cost estimates. Quantity takeoff methods were previously described in Section 21.5.1.1. Installation costs were determined from vendor/contractor quotes, labor and equipment rates and production estimates.
Preliminary Assessment, Lost Creek Property
Expensed portions of Resource Areas 2 through 5 consist of:
983 injection wells,
561 recovery wells,
94 vertical monitor wells
109 horizontal monitor wells, and
28 header houses
Additionally, trunk and feeder pipelines, electrical service and wellfield fencing are included.
21.6.8 Process Plant Reagents
The initial chemical reagent loading of the system is included in CAPEX costs. Chemical consumption for the Plant has been estimated based on the proposed process design. Oxygen and carbon dioxide reagent costs are included under wellfield operations costs.
21.6.9 Process Plant Maintenance
Maintenance and repairs to the Plant have been estimated at two percent of CAPEX costs.
21.6.10 Plant Power
Power costs for the wellfields are included in the wellfield operations costs described above. The estimated annual power costs for the Plant and appurtenant buildings is based on estimated power consumption for major process equipment and services including lights, pumps, motors, filter press, dryer, heating, air conditioning and hot water, and basic service and demand charges from the local electrical utility.
21.6.11 Access Road Maintenance
Because primary access roads near the Project have been constructed by other operators in the area, URE will share costs for access including road maintenance and snow plowing. This service will either be contracted to a local provider or performed in house. Road grading is anticipated to be needed monthly and snow plowing weekly for six months per year.
21.6.12 Product Freight
It has been assumed for this PA that Uranium product (yellowcake) will be shipped via truck 1,200 miles to the Honeywell Uranium Hexafluoride processing facility in Metropolis, Illinois. An average truck shipment contains approximately 40 drums, or up to 38,000 pounds (19 tons) of yellowcake. Based on the projected annual production rate ranging from 192,000 to 1,058,000 pounds of yellowcake per year, approximately five to 28 shipments with 40 drums each would be required annually for a total of over 126 shipments over the life of the Project.
21.6.13 Waste Disposal
It is estimated that the site will produce approximately 500 to 700 cubic yards of non-contaminated solid waste per year. This estimate is based on the waste generation rates of similar uranium ISR facilities. Non-contaminated solid waste will be collected on the site in designated areas and disposed of in the nearest permitted sanitary landfill.
Preliminary Assessment, Lost Creek Property
Contaminated solid waste consists of solid waste contaminated with radioactive material and that cannot be decontaminated. This byproduct material will consist of filters, personal protective equipment, spent resin, piping, etc. These materials will be temporarily stored on site and periodically transported for disposal. URE will establish an agreement for disposal of this waste as 11e.(2) byproduct material in a licensed mill tailings facility.
It is estimated that the site will produce approximately 90 cubic yards of 11e.(2) byproduct material as waste per year. This estimate is based on the waste generation rates of similar in situ uranium recovery facilities. Minor amounts of radioactive material could also be entrained in Plant wash water. This will be disposed of in a UIC Class I DDW.
21.7 Closure
21.7.1 Well Abandonment/Aquifer Restoration
After economic recovery in each Resource Area is completed, aquifer restoration will begin as soon as practical. If a completed Resource Area or header house group is near an area that is being mined, a portion of the completed area’s restoration may be delayed to limit interference with the on-going extraction operations. The exact Resource Area size and location may change based on the final delineation results of the mineralized zone and the actual production performance of the particular mineralized zone.
The aquifer restoration of each Resource Area is largely dependent on the size and number of header houses. Restoration completion assumes 0.3 pore volumes of groundwater sweep and six pore volumes of groundwater that has been treated by reverse osmosis followed by one pore volume of recirculation (homogenization). The six pore volumes has been demonstrated to and accepted by WDEQ in URE’s initial surety bond calculations.
Following completion of successful restoration activities, the pumps and packer assemblies will be removed from all injection and recovery wells. Each well will then be abandoned in accordance with WDEQ/LQD requirements. Monitor wells will also be abandoned following verification of successful aquifer restoration.
21.7.2 Demolition and Removal of Infrastructure
Simultaneous with well abandonment operations, the trunk and feeder pipelines will be removed, tested for radiological contamination, segregated as either radiologic waste or non-radiologic solid waste, shipped and transported to appropriate disposal facilities. The header houses will be disconnected from their foundations, decontaminated, segregated as either radiological waste or non-radiologic solid waste, cut and crushed and transported to appropriate disposal facilities. The Plant, processing equipment, office, laboratory and maintenance buildings will be demolished, tested for radiological properties, segregated and either scrapped or disposed of in appropriate disposal facilities based on their radiological properties.
21.7.3 Site Grading and Re-vegetation
Following the removal of wellfield and Plant infrastructure, site roads will be removed and the site will be re-graded to approximate pre-development contours and the stockpiled topsoil placed over disturbed areas. The disturbed areas will then be seeded.
21.7.4 Closure Costs
Restoration and closure and bond costs for the Project are estimated to be approximately $21.15 million. Details of the closure cost estimate is provided in Table S-2. The closure costs are based on 2011 dollars and material volumes developed in conjunction with the CAPEX estimates in this PA. Unit costs for closure are based on TREC data and historical costs for similar work.
Preliminary Assessment, Lost Creek Property
21.8 Mine Life
The Authors have estimated the mine life based on the five Resource Areas, as currently defined on the Project. Figure 18 provides the operating and production schedule for the Project as currently defined. The overall mine life, as illustrated in Figure 18, is 11 years from initiation of construction activities to completion of restoration and decommissioning/reclamation.
It is estimated that the production life for each header house will be approximately one year. Production will be occurring at each Resource Area consecutively and simultaneously (see Figure 18) and, as such, Project production will occur over a period of approximately six years. Restoration and reclamation will also be implemented concurrently with production and will continue beyond the production period. The total estimated wellfield operation schedule is, therefore, approximately ten years.
The Project cash flow analysis assumes closure of the wellfields and Plant approximately four years after economic depletion of the uranium within the target mineralized zones of the five Resource Areas.
21.9 Economic Analysis
Cautionary statement: this PA is preliminary in nature, and includes inferred mineral resources that are considered too speculative geologically to have the economic considerations applied to them that would enable them to be categorized as mineral reserves. The estimated mineral recovery used in this PA is based on both site-specific laboratory recovery data as well as URE personnel and industry experience at similar facilities. There can be no assurance that recovery at this level will be achieved.
Figure 18 presents the Project schedule, as currently defined, used to develop cash flow and economic analysis from the CAPEX, OPEX, pre-production and reclamation/closure costs.
Preliminary Assessment, Lost Creek Property
Preliminary Assessment, Lost Creek Property
A cash flow statement has been developed based on the CAPEX, OPEX and Closure cost estimates and the attached production schedule. The statement assumes no escalation, no debt, no debt interest, no corporate income tax or capital repayment. The sale price for the produced uranium is assumed at a variable price per pound for the life of the Project ranging from $55 to $80 per pound. This price is based on RBC Dominion Securities, Uranium Market Outlook for the Fourth Quarter of 2010 (RBC, 2010).
Uranium recovery from the mineral resource is assumed based on an estimated wellfield recovery factor of 80 percent. The attached production schedule assumes an average solution uranium grade (head grade) of approximately 42 mg/L. The sales for the cash flow are developed by applying the recovery factor to the resource estimate for the Project (Section 19.0). The total uranium production over the life of the Project is estimated to be 4.81 million pounds. The production estimates and OPEX cost distribution used to develop the cash flow are based on the production and restoration schedule presented in Figure 18.
This PA assumes the Project start date of January 1, 2011. Pre-production expenses start on the Project start date. Capital expenditure/construction is assumed to start one year later and the start of production is in the fourth quarter after the start of construction. The NPV assumes cash flows take place in the middle of the periods and is calculated based on a discounted cash flow.
The Net Present Value (NPV) for three discount rates has been calculated and is presented in Table 18. The estimated IRR is also presented.
Table 18: Net Present Value Versus Discount Rate and IRR
|
Discount Rate (%)
|
NPV ($US 000’s)
|
|
5
|
$ 137,587
|
|
8
|
$ 118,052
|
|
10
|
$ 106,773
|
| |
|
|
IRR
|
91%
|
The Project has initial capital costs of $35.06 million including Plant cost of $17.5 million, pre-production costs of $7.8 million, initial wellfield costs of $5.62 million; DDW cost $4.125 million. The estimated payback is in Quarter 4 of 2013 assuming the commencement of construction in Quarter 1 of 2012 and generates net earnings before income tax over the life of the Project of $178.9 million. It is estimated that the Project has an internal rate of return (IRR) of 91 percent and a NPV of $118.1 million applying an 8 percent discount rate. See Table 19.
Preliminary Assessment, Lost Creek Property
Table 19: Cash Flow Statement ($US 000s), Lost Creek Property
Table 19
Cash Flow Statement ($US 000s)
Lost Creek Property
Ur-Energy
|
Uranium Price (3):
|
|
$ |
65.00 |
|
$ |
75.00 |
|
$ |
80.00 |
|
$ |
80.00 |
|
$ |
80.00 |
|
$ |
80.00 |
|
$ |
80.00 |
|
$ |
80.00 |
|
$ |
70.00 |
|
$ |
55.00 |
|
$ |
55.00 |
|
$ |
55.00 |
|
$ |
55.00 |
|
|
|
|
Item
|
|
Year -1 (2011)
|
|
Year 1 (2012)
|
|
Year 2 (2013)
|
|
Year 3 (2014)
|
|
Year 4 (2015)
|
|
Year 5 (2016)
|
|
Year 6 (2017)
|
|
Year 7 (2018)
|
|
Year 8 (2019)
|
|
Year 9 (2020)
|
|
Year 10 (2021)
|
|
Year 11 (2022)
|
|
Year 12 (2023)
|
|
Total
|
|
|
UR Energy Production
('000 lbs) (1)(2)
|
|
|
0 |
|
|
99 |
|
|
1,032 |
|
|
1,081 |
|
|
1,081 |
|
|
1,081 |
|
|
431 |
|
|
0 |
|
|
0 |
|
|
0 |
|
|
0 |
|
|
0 |
|
|
0 |
|
|
4,805 |
|
|
Gross Sales (3)(4)
|
|
$ |
0.0 |
|
$ |
7,412.2 |
|
$ |
82,567.8 |
|
$ |
86,482.8 |
|
$ |
86,482.8 |
|
$ |
86,482.8 |
|
$ |
34,445.5 |
|
$ |
0.0 |
|
$ |
0.0 |
|
$ |
0.0 |
|
$ |
0.0 |
|
$ |
0.0 |
|
$ |
0.0 |
|
$ |
383,873.9 |
|
|
less: extraction and private royalty fees at 1.67% royalty
|
|
$ |
0.0 |
|
$ |
326.0 |
|
$ |
459.0 |
|
$ |
459.0 |
|
$ |
459.0 |
|
$ |
0.0 |
|
$ |
91.5 |
|
$ |
0.0 |
|
$ |
0.0 |
|
$ |
0.0 |
|
$ |
0.0 |
|
$ |
0.0 |
|
$ |
0.0 |
|
$ |
1,794.7 |
|
|
less: Gross Products+Severance tax (6)
|
|
$ |
0.0 |
|
$ |
459.4 |
|
$ |
4,961.6 |
|
$ |
5,195.8 |
|
$ |
5,195.8 |
|
$ |
5,173.2 |
|
$ |
2,065.0 |
|
$ |
0.0 |
|
$ |
0.0 |
|
$ |
0.0 |
|
$ |
0.0 |
|
$ |
0.0 |
|
$ |
0.0 |
|
$ |
23,050.8 |
|
|
Net Sales
|
|
$ |
0.0 |
|
$ |
6,626.7 |
|
$ |
77,147.1 |
|
$ |
80,828.0 |
|
$ |
80,828.0 |
|
$ |
81,309.6 |
|
$ |
32,289.0 |
|
$ |
0.0 |
|
$ |
0.0 |
|
$ |
0.0 |
|
$ |
0.0 |
|
$ |
0.0 |
|
$ |
0.0 |
|
$ |
359,028.4 |
|
|
Operational Costs
|
|
|
|
|
|
|
|
|
|
|
|
|
|
|
|
|
|
|
|
|
|
|
|
|
|
|
|
|
|
|
|
|
|
|
|
|
|
|
|
|
|
|
|
|
Total Op Costs
|
|
$ |
0.0 |
|
$ |
10,057.1 |
|
$ |
17,924.5 |
|
$ |
14,213.3 |
|
$ |
12,354.3 |
|
$ |
14,124.5 |
|
$ |
8,902.1 |
|
$ |
6,786.7 |
|
$ |
-736.5 |
|
$ |
3,900.1 |
|
$ |
-8,153.9 |
|
$ |
-8,079.9 |
|
$ |
0.0 |
|
$ |
71,292.5 |
|
|
Wellfield Development (5)
|
|
$ |
0.0 |
|
$ |
5,619.1 |
|
$ |
11,238.2 |
|
$ |
11,238.2 |
|
$ |
11,238.2 |
|
$ |
11,238.2 |
|
$ |
0.0 |
|
$ |
0.0 |
|
$ |
0.0 |
|
$ |
0.0 |
|
$ |
0.0 |
|
$ |
0.0 |
|
$ |
0.0 |
|
$ |
50,572.1 |
|
|
Total Closure Costs
|
|
$ |
0.0 |
|
$ |
0.0 |
|
$ |
1,057.5 |
|
$ |
1,057.5 |
|
$ |
1,057.5 |
|
$ |
1,057.5 |
|
$ |
1,057.5 |
|
$ |
1,057.5 |
|
$ |
2,115.0 |
|
$ |
2,115.0 |
|
$ |
4,230.1 |
|
$ |
5,287.6 |
|
$ |
1,057.5 |
|
$ |
21,150.5 |
|
|
Home Office Support and Allocated Overhead
|
|
$ |
175.0 |
|
$ |
175.0 |
|
$ |
175.0 |
|
$ |
175.0 |
|
$ |
175.0 |
|
$ |
175.0 |
|
$ |
175.0 |
|
$ |
175.0 |
|
$ |
175.0 |
|
$ |
175.0 |
|
$ |
175.0 |
|
$ |
75.0 |
|
$ |
0.0 |
|
$ |
2,000.0 |
|
|
Project Cash Flow
|
|
$ |
-175.0 |
|
$ |
-9,224.5 |
|
$ |
46,751.9 |
|
$ |
54,143.9 |
|
$ |
56,002.9 |
|
$ |
54,714.3 |
|
$ |
22,154.4 |
|
$ |
-8,019.3 |
|
$ |
-1,553.6 |
|
$ |
-6,190.2 |
|
$ |
3,748.8 |
|
$ |
2,717.3 |
|
$ |
-1,057.5 |
|
$ |
214,013.4 |
|
|
Capitalized Costs
|
|
|
|
|
|
|
|
|
|
|
|
|
|
|
|
|
|
|
|
|
|
|
|
|
|
|
|
|
|
|
|
|
|
|
|
|
|
|
|
|
|
|
|
|
Pre-Production Costs
|
|
$ |
2,945.6 |
|
$ |
4,898.6 |
|
$ |
0.0 |
|
$ |
0.0 |
|
$ |
0.0 |
|
$ |
0.0 |
|
$ |
0.0 |
|
$ |
0.0 |
|
$ |
0.0 |
|
$ |
0.0 |
|
$ |
0.0 |
|
$ |
0.0 |
|
$ |
0.0 |
|
$ |
7,844.2 |
|
|
Capital expenditure (7)
|
|
$ |
5,442.3 |
|
$ |
21,769.3 |
|
$ |
0.0 |
|
$ |
0.0 |
|
$ |
0.0 |
|
$ |
0.0 |
|
$ |
0.0 |
|
$ |
0.0 |
|
$ |
0.0 |
|
$ |
0.0 |
|
$ |
0.0 |
|
$ |
0.0 |
|
$ |
0.0 |
|
$ |
27,211.6 |
|
|
CASH FLOW AFTER CAPEX
|
|
$ |
-8,562.9 |
|
$ |
-35,892.4 |
|
$ |
46,751.9 |
|
$ |
54,143.9 |
|
$ |
56,002.9 |
|
$ |
54,714.3 |
|
$ |
22,154.4 |
|
$ |
-8,019.3 |
|
$ |
-1,553.6 |
|
$ |
-6,190.2 |
|
$ |
3,748.8 |
|
$ |
2,717.3 |
|
$ |
-1,057.5 |
|
$ |
178,957.6 |
|
|
Opening cash balance
|
|
$ |
0.0 |
|
$ |
-8,562.9 |
|
$ |
-44,455.3 |
|
$ |
2,296.6 |
|
$ |
56,440.5 |
|
$ |
112,443.4 |
|
$ |
167,157.7 |
|
$ |
189,312.1 |
|
$ |
181,292.8 |
|
$ |
179,739.2 |
|
$ |
173,549.0 |
|
$ |
177,297.8 |
|
$ |
180,015.1 |
|
|
|
|
|
Closing Cash Balance
|
|
$ |
-8,562.9 |
|
$ |
-44,455.3 |
|
$ |
2,296.6 |
|
$ |
56,440.5 |
|
$ |
112,443.4 |
|
$ |
167,157.7 |
|
$ |
189,312.1 |
|
$ |
181,292.8 |
|
$ |
179,739.2 |
|
$ |
173,549.0 |
|
$ |
177,297.8 |
|
$ |
180,015.1 |
|
$ |
178,957.6 |
|
|
|
|
|
|
Notes:
|
1.
|
Production is based on a 80% recovery of the total of Measured, Indicated, and Inferred resources per NI 43-101 Section 2.3(3).
|
|
|
2.
|
Production is in years 2012 through 2017 and assumes applicable permits and licenses are received in time to start production in early 2012.
|
|
|
3.
|
Uranium Price from RBC Dominion Securities - Uranium Market Outlook, Fourth Quarter 2010.
|
|
|
4.
|
All amounts in US $ 000s.
|
|
|
5.
|
Wellfield Development costs after production start are included as an Operational Expense, and averaged between the years of development
|
|
|
6.
|
Gross products and Severance tax amounts are based on a variable Gross Products Tax rate and Severance Tax rate of 4%.
|
|
|
7.
|
Plant CAPEX, two deep disposal wells and the first wellfield area (20% of total) are included in Year -1 (2011). Well-field costs are expensed 20% Years 2012-2016.
|
|
|
8.
|
Income Tax Is Not included In Lost Creek Project Cash Flow.
|
The IRR and NPV analyses are based on Years -1 to Year 12.
|
IRR =
|
91% assuming no depreciation, no income tax, no escalation, and variable uranium price as indicated above.
|
Net Present Value Versus Discount Rate
|
Discount Rate
|
|
NPV ($US 000s)
|
|
5%
|
|
$137,587
|
|
8%
|
|
$118,052
|
|
10%
|
|
$106,773
|
Preliminary Assessment, Lost Creek Property
This analysis is based on a variable commodity price, based on data from RBC (RBC, Q4 2010) and the cash flow results presented herein. The sensitivity to changes in the price of uranium, CAPEX and OPEX have been calculated from the cash flow statements and are presented below.
The Project is sensitive to changes in the price of uranium as shown in the figure below (NPV vs Variable Uranium Price). A one dollar change in the commodity price results in a US $3.37 million dollar change (IRR: approximately 2.0 percent) to the NPV at a discount rate of eight percent. This analysis is based on a variable commodity price per pound. The Project is also slightly sensitive to changes in either CAPEX or OPEX costs as shown in the figure below (NPV vs CAPEX Variation and NPV vs OPEX Variation). A five percent variation in OPEX results in a $3.24 million variation in NPV and a five percent variation in CAPEX results in a $3.02 million variation to the NPV. This analysis is based on an eight percent discount rate and a variable commodity price per pound.
21.9.1 Capital and Operating Costs
CAPEX and OPEX costs were discussed in Sections 21.5 and 21.6 and are summarized in Tables S-2 and S-3. CAPEX costs are sensitive to wellfield costs – which may increase if well spacing needs to be reduced or additional injection/recovery wells are required. In addition, a shortage of drilling rigs and the increasing costs of well and piping materials (PVC, HDPE) may also lead to increased CAPEX costs. Delays in regulatory approvals or additional requirements from regulatory agencies to obtain approvals could also increase CAPEX costs. Operating costs are sensitive to labor costs due to possible labor shortages and the need to provide increased compensation packages to attract workers as a result of potential low unemployment in Wyoming and employee competition from other natural resource extraction industries.
Preliminary Assessment, Lost Creek Property
21.9.2 Taxation
The current Wyoming severance tax for uranium is four percent but after the wellhead deduction it is approximately three percent of gross sales. In addition, the ad valorum (gross products) tax varies but is anticipated to average 6.6 percent. In aggregate and based on the taxable portion of the product, the total tax averages approximately 6.4 percent of gross sales. At the federal level, profit from mining ventures is taxable at corporate income tax rates. For mineral properties, depletion tax credits are available on a cost or percentage basis, whichever is greater. The economic evaluation in this PA is pre-tax, but does included severance and ad valorum.
21.10 Project Implementation and Execution Plan
A Gantt chart illustrating the Project implementation schedule is provided in Figure 18. The chart shows the proposed plan for production, ground water restoration, and decommissioning of each wellfield and alternative. However, the plan is subject to change due to extraction schedules, variations with Resource Area recoveries, Plant issues, economic conditions, etc.
21.11 Risk Assessment
The Project is located in a State where ISR projects have been and are operated successfully. The ISR technology has been proven effective in geologic formations within Wyoming as described in Section 20.2. Two Wyoming ISR facilities are currently in operation (Smith Ranch and Christensen Ranch).
The Property is located in the northeastern corner of Sweetwater County, south-central Wyoming, USA. The Project is located in an unpopulated area about 15 miles southwest of Bairoil, Wyoming, about 38 miles northwest of Rawlins, and about 90 miles southwest of Casper. The Property area covers approximately 33,794 acres of which 4,254 acres comprise the Project. Electrical power and a major transportation corridor (Interstate 80) are located within or near the site. Thus, the basic infrastructure necessary to support an ISR mining operation - power, water and transportation, are located within reasonable proximity of the site.
The following sections describe the potential risks to development of the Project and attainment of the financial results presented in this PA.
21.11.1 Uranium Recovery and Processing
Bench-scale tests have been performed on core samples from this Project. The most significant potential risks to meeting the production and thus financial results presented in this PA will be associated with the success of the wellfield operation and extraction of uranium from the targeted host sands. Potential problems that could occur in the wellfield extraction process include unknown or changing geochemical conditions resulting in uranium recovery rates from the mineralized zones that are significantly different than previous bench-scale tests. Another potential concern is reduced hydraulic conductivity in the formation due to chemical precipitation or lower hydraulic conductivities than estimated, high flare and/or recovery of significant amounts of groundwater, the need for additional injection wells to increase uranium recovery rates in the lixiviant, variability in the uranium concentration in the host sands and discontinuity of the mineralized zone confining layers. The risks associated with these potential issues have been minimized to the extent possible by extensive delineation and hydraulic studies of the site.
Preliminary Assessment, Lost Creek Property
Process risk encompasses the risk associated with the process selection for recovering uranium, its proper implementation and attaining a final uranium product of acceptable quality. The Plant will be designed for average rich lixiviant flow rates and characteristics and the performance of the Plant and uranium production will vary with these criteria. Rich lixiviant properties, in particular solids and impurity contents, will also influence Plant operation. Continual monitoring of rich lixiviant quality, tank bottoms chemistry and uranium product will be performed to optimize the process and provide for acceptable quality of the final product.
21.11.2 Delays in Obtaining Licenses/Permits and Approvals
The most significant potential risk to attaining the performance described in this PA is that of obtaining the required licenses/permits and approvals needed to commence mining in a timely fashion. This PA assumes that licenses/permits and approval will be obtained, and initiation of wellfield and facility construction will occur by early 2012. The timeframe for obtaining licenses/permits and approvals could be extended as the regulating authorities, i.e., the Wyoming DEQ and USNRC, are understaffed with personnel experienced in uranium mining and processing.
The three most significant permits/licenses are (1) the Permit to Mine, issued by the WDEQ/LQD, (2) the Source and Byproduct Materials License, required and issued by the NRC for mineral processing of natural uranium and (3) the BLM Plan of Operations.
WDEQ/LQD completed its technical review of URE’s Permit to Mine application and is moving toward issuance of the permit. Other uranium operating companies with similar permit applications for Wyoming ISR mines have recently had those permits approved. NRC issued a Draft Source and Byproduct Materials License for the Project on January 11, 2011 stating “environmental impacts of the proposed action (issuing a source material license for the proposed Lost Creek ISR Project) are not so great as to make issuance of a source material license an unreasonable licensing decision”. The NRC remains on schedule to issue the final Source and Byproduct Material License prior to the end of Quarter 2 of 2011.
The BLM has determined that this Project requires an EIS be developed prior to approval. URE’s Plan of Operations has been provided as the basis for BLM’s preparation of the EIS document, and the BLM has indicated it may adopt part or all of the NRC NEPA documents. Of the state or federal agencies involved in mine permitting or licensing in Wyoming, the BLM has been the slowest and most uncertain in implementing the required regulatory processes for approval.
21.11.3 Market and Contracts
Unlike other commodities, uranium does not trade on an open market. Contracts are negotiated privately by buyers and sellers. Changes in the price of uranium can have a significant impact on the economic performance of the Project. As discussed in Section 21.9, a $1.00 change in the price of uranium can have an impact to the NPV and IRR of approximately $3.4 million and 2.0 percent, respectively based on a discount rate of eight percent. This analysis assumes a variable price per pound for U3O8 over the life of the Project, based upon RBC Dominion Securities, Uranium Market Outlook, Q4 2010 which provides uranium price forecasts on a forward-looking basis. The Authors believe that these estimates are appropriate for use in this evaluation.
Preliminary Assessment, Lost Creek Property
The marketability of uranium and acceptance of uranium mining is subject to numerous factors beyond the control of URE. The price of uranium may experience volatile and significant price movements over short periods of time. Factors known to affect the market and the price of uranium include demand for nuclear power; political and economic conditions in uranium mining, producing and consuming countries; costs; interest rates, inflation and currency exchange fluctuations; governmental regulations; availability of financing of nuclear plants, reprocessing of spent fuel and the re-enrichment of depleted uranium tails or waste; sales of excess civilian and military inventories (including from the dismantling of nuclear weapons) by governments and industry participants; production levels and costs of production in certain geographical areas such as Russia, Africa and Australia; and changes in public acceptance of nuclear power generation as a result of any future accidents or terrorism at nuclear facilities.
Contracts are in place with regard to certain purchases of equipment, and are within industry norms. URE has completed its first uranium sales agreement with a three-year term at defined pricing within industry norms. The agreement relates to a non-material portion of anticipated production during the defined term and, together with its defined pricing, is therefore not considered to materially affect the analysis in this report.
21.11.4 Resources
As previously discussed, both past and current NI 43-101-compliant mineral resource estimates have been made for this Project.
The resource estimate method employed in this PA (GT contour) can be completed in areas where drilling density is adequate to prepare a detailed mapping of the areal and stratigraphic extents of the mineralization. The result identifies mineralization that is of suitable grade and quantity to be recovered by ISR techniques. At this time, not all of the Project area has been drilled to a density adequate to utilize the more detailed GT contour resource estimation method. Although the entire Project cannot be evaluated, the Authors have selected to use the current results of the GT contour method in the presentation of the Project economic assessment because of the higher level of confidence the method produces.
Although the GT contour method provides greater confidence in the resource estimate than a polygonal method approach, it is difficult to predict the percentage recovery which will be achieved with ISR projects. This makes it difficult to determine reserve estimates for ISR projects. As such, the estimated quantity of uranium recovered used in this PA is based primarily on the recovery data from site-specific, bench-scale testing of mineralized samples. The recovery value of 80 percent, used herein, is on the high end of typical industry experience for wellfield recovery but appears justified based on site-specific data. However, the Authors can provide no assurance that recovery at such a level will be achieved.
This PA is preliminary in nature and uses a sum of inferred as well as measured and indicated resources. The inferred resources used in this PA are too speculative geologically to have the economic considerations applied to them that would enable them to be categorized as mineral reserves. There is no certainty that the mineral recovery or the economics presented in this PA will be realized. This PA is based on the assumptions and information presented herein.
Figure 20 illustrates the sensitivity of NPV to uranium resource recovery. The NPV changes approximately $33.62 million per ten percent change in uranium recovery based on an eight percent discount rate.
Preliminary Assessment, Lost Creek Property
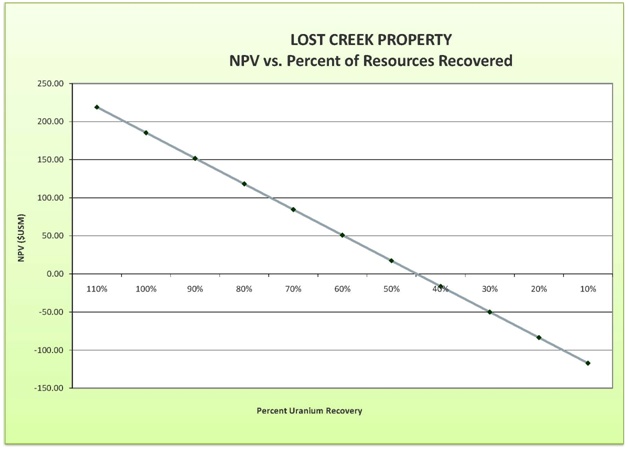
21.11.5 Sage Grouse
The state of regulations and restrictions on development within certain “core” areas of Wyoming for the purpose of protecting the Greater Sage Grouse species has been dynamic over the past several years. The State of Wyoming has developed a Core Area Strategy to help protect the species and Property exploration areas and the Project are within one of these core areas. They are then subject to protective restrictions – namely a restriction that exploration drilling and other activities which may disturb the sage grouse from March 1 to July 15 of each year. While current restrictions do not effectively limit exploration drilling, nor is it currently anticipated to restrict or limit mining activities, as described in Section 7.4, a significant change in the population of the species or an unforeseen catalyzing event or political change could result in more significant restrictions to exploration or mining. Additionally, if the Sage Grouse is listed as an endangered or threatened species, or species of special concern, in the future, the status of mineral development in Sage Grouse habitats will be uncertain. Any such listing is not anticipated prior to development of the Project.
21.11.6 Deep Disposal Wells
UIC DDWs will be required for disposal of wellfield bleed and other non-hazardous liquid wastes generated from the production process (bleed from aquifer restoration). A UIC DDW permit has been obtained from the WDEQ. One of the five permitted DDWs has been installed. The existing well was drilled to 10,000 ft depth. Accurate costs and water quality were obtained during the installation thus reducing the risk in installing the second well required for operation at this production rate.
Preliminary Assessment, Lost Creek Property
21.11.7 Radiological Waste
The cost for disposal of radiological waste can be high, variable, and licensed disposal facilities are limited. The availability of long-term disposal services cannot be predicted. Additionally, as more uranium mining operations come on line, the demand for disposal of radiological waste will increase, potentially leading to price increases. However, Pathfinder Mines Corporation, at their Shirley Basin, Wyoming facility may be available for disposal of radiological waste. This PA assumes that a contract can be developed for 11e.(2) byproduct disposal for this Project.
21.11.8 Radiological
Soil contamination, radioactive dust and air emissions that may result from the operation are considered a low possibility. The operation of the Project is not anticipated to impose a significant dose to any worker or individual member of the public. Based on permit applications developed by URE and other operators at proposed ISR mining operations it is anticipated that the Project will not appreciably contribute to total population dose (URE, 2007a). This PA assumes the risk of radiological exposure of workers and the public is minor and does not impact Project financial performance.
21.11.9 Political
With regard to the socioeconomic and political environment, Wyoming mines have produced over 200 million pounds of uranium from both conventional and ISR mines and mill operations. The State is ranked as the number one US producer of uranium since 1994. Current Wyoming uranium production is from ISR mining operations. Wyoming is generally favorable to mine developments provided established environmental regulations are met.
There is at least one opposition group which opposes nuclear energy and uranium development. At this time, this group is fairly small and does not appear to have a significant following. Several environmental groups have begun to publicly support nuclear energy as an alternative to fossil fuel energy sources. Generally, groups opposing well thought out natural resource developments do not ultimately stop development. However, they can affect schedules and increase development costs. This PA assumes this to be a minor issue and will not impact financial performance. The Authors anticipate this to be the case unless a strong national opposition to the nuclear industry develops which would curtail demand for nuclear fuel.
21.11.10 Transport
Any accident that results during the shipment of yellowcake product could result in yellowcake being spilled. In the event that such an accident does occur, all yellowcake and contaminated soil would be removed, processed through a uranium mill, or disposed of in a disposal facility licensed by the NRC. All areas that are disturbed by the accident would then be reclaimed in accordance with all applicable NRC and state regulations.
The risk of an accident involving the transporting of yellowcake resulting in a spill will be kept to a minimum through the use of “exclusive use” shipments. If an accident were to occur, impact to the environment would be further reduced by following the procedures provided in the URE Incident Response Guide (to be developed as required by the NRC license). This guide will be included with every shipment of yellowcake that leaves the Project facility. The contract carrier will also be required to maintain accident response capability to specifically include spill response.
With the shipment of yellowcake product to a conversion facility located approximately 1,200 miles away, all risks associated with the transportation of the product cannot be eliminated. However, the potential impacts to the environment in the event of an accident can be minimized through implementation of proper procedures to ensure that any yellowcake that is spilled is contained as soon as possible and the area affected by the spill is secured and cleaned up to avoid contact with humans and animals.
Preliminary Assessment, Lost Creek Property
21.11.11 Fire Protection
Fire and explosion hazards at the Project facilities will be low based on the chemical requirements of ISR mining and processing. Propane will be utilized for the heating of oil for the vacuum dryer. The propane would be the primary source for a potential fire or explosion at the facility. Building heat will be supplied by either electric or propane heaters. If an explosion were to occur at the Plant, it is not anticipated that the uranium present in the Plant would appreciably disperse to the environment. Plant components are designed to contain process fluids or solids including yellowcake.
Additionally, as required by Sweetwater County, the Plant, offices and shop building will be equipped with a fire protection system. The system will conform to the standards of either the International Fire Code or the National Fire Protection Association 1142 (standard on water supplies for suburban and rural fire fighting).
Contamination of hot, dried yellowcake (containing hydrogen peroxide) and organic material also presents a fire hazard. The only likely organic contamination source for the dried yellowcake is the thermal transfer oil used to heat and dry the product. Any leak between the heating coils and the inside of the dryer will be immediately evident due to a lack, or loss of vacuum causing the system to shut itself in.
If a drum of dried yellowcake is sealed before the product has had time to cool sufficiently, excessive pressure can be created in the steel drum. This could potentially cause the drum to rupture with dramatic results, but does not present a fire hazard.
Potential fire and explosions for the wellfields would be from concentrations of gaseous oxygen. If a gaseous oxygen accumulation were to occur in the header house and then be ignited through some ignition source, an explosion could occur. The explosion could result in the rupture of pipelines containing mining solutions within the header houses and a spill to the area surrounding the header house. This will be mitigated through the use of fail-safe control valves on the oxygen system, automated shut-down of injection and recovery solutions and a continuously operating exhaust fan in the header houses.
21.11.12 Reagent Storage
The Plant design has taken into account the requirements for safe storage of chemicals. Hydrochloric acid and hydrogen peroxide chemical storage tanks will include secondary containment. Oxidants such as hydrogen peroxide will be isolated from other chemicals and Plant personnel.
Preliminary Assessment, Lost Creek Property
21.11.13 Chemical Spills
The Project Plant and contract chemical transporters will have spill prevention, containment and countermeasures plans for control and response to chemical releases. Although possible, the risk of chemical spills is considered minor assuming proper handling and control measures are established and implemented.
Truck shipments of process chemicals to the Project site could result in local environmental impacts if the trucks are involved in an accident. Any spills would be removed and the affected area remediated and reclaimed. The process chemicals used at an ISR facility in truck load quantities are common to many industries and present no abnormal risk. Since most of the material would be recovered or could be removed, no significant long-term environmental impacts would result from an accident involving the process chemicals.
A potentially hazardous reagent used in some ISR processes is anhydrous ammonia. URE does not plan to use anhydrous ammonia in the precipitation circuit at the Project Plant.
21.11.14 Occupational Health and Safety
Operations at the Project site and facilities will be conducted in conformance with applicable laws, regulations and requirements of the various federal and state regulatory agencies. The organization and management controls will be described in the license/permit applications and will be established to ensure compliance and further implement the company’s policy for providing a safe working environment including the philosophy of maintaining radiation exposures as low as reasonably achievable (ALARA).
|
22.0
|
Interpretation and Conclusions
|
The proposed wellfield, recovery and processing facilities are very similar to other operations in the State of Wyoming. The site is remote but located within a few miles of paved highways and adjacent to graveled access roads. Power and communications are also available.
The Project, at the current state of exploration and development, contains an estimated mineral resource of 5.22 million pounds Measured and Indicated Mineral Resource contained in 4.73 million tons at 0.055 percent uranium as eU3O8; and an additional 0.783 million pounds Inferred Mineral Resource contained in 0.773 million tons at 0.051 percent uranium as eU3O8. The uranium in the Project area has shown amenability to ISR extraction from Project site-specific bench-scale core leach testing. The mineralization, at the current state of exploration and development, at the Project is contained in the HJ and KM Horizons of the Battle Spring Formation. The sand units will be mined using injection and recovery wells designated specifically for the target sand horizons.
An economic analysis has been performed based on the current Project uranium production estimates using the attached production schedule in conjunction with the estimated recoverable resource of 4.81 million pounds of uranium. A recovery factor of 80 percent was used in the economic evaluation and is in line with CIM guidance (CIM Council, 2003). Based on the estimated recovery of 4.81 million pounds of U3O8, the potential economic performance of the Project is summarized in Table 20.
Preliminary Assessment, Lost Creek Property
Table 20: Net Present Value Versus Discount Rate and IRR
|
Discount Rate (%)
|
NPV ($US 000’s)
|
|
5
|
$ 137,587
|
|
8
|
$ 118,052
|
|
10
|
$ 106,773
|
| |
|
|
IRR
|
91%
|
This analysis also assumes a variable price per pound for U3O8 over the life of the Project (RBC Dominion Securities, Uranium Market Outlook, Q4 2010). The calculated price per pound of uranium produced is $42.65 per pound including all costs, with an estimated operational cost of $19.66 per pound.
Some operational risks exist in the Project implementation but are generally considered to be addressable either though wellfield modifications or Plant optimization. The start of operations could be delayed awaiting license and permit approvals. The Plant will be designed as a batch drying operation and allows for process variations.
The IX and elution processes have been, and are being used at other ISR facilities in Wyoming, Texas, and Nebraska. The process does not use any unusual or innovative methods and the reagents for the process are readily available from regional sources. Initial process optimization will be required to minimize the use of reagents, minimize loss of product and ensure proper product quality.
Health and safety programs will be implemented to control the risk of on and off site exposures to uranium and process chemicals. Standard industry practices exist for this type of operation and novel approaches to risk control and management will not be required.
Therefore, the results of this PA demonstrate both the technical and economic viability of the Project.
The results of the PA, based on assumptions and calculations presented herein, indicate that the Project is technically and economic viable. The results indicate that the Project is at the stage for development. In order to realize the full economic benefits described in this PA, the following activities are recommended/required:
|
|
·
|
That URE pursue and execute an 11(e).2 Byproduct/Waste Disposal Agreement (with licensed tailings operator) in a timeframe consistent with mine permit/license approval. This recommendation would result in little or no costs outside URE labor.
|
|
|
·
|
Continue delineation drilling for mine planning and to expand resources within the Project boundary that may lead to fully defining additional Resource Areas for the Project and adjoining properties. This recommendation would result in costs to URE in the range of $8 to $10 million.
|
|
|
·
|
Conduct additional delineation drilling in Resource Areas containing Indicated and Inferred Mineral Resources. Any such additional mining targets were not included in the evaluation in this PA. This recommendation would result in costs to URE in the range of $5 to $7 million.
|
Preliminary Assessment, Lost Creek Property
|
|
·
|
Evaluate and pursue, if appropriate, permit license amendments to allow mining of the KM Horizon and any other appropriate horizons identified by any future exploration and delineation drilling, per the recommendation above. This recommendation would result in costs to URE in the range of $1 to $2 million.
|
|
|
·
|
With regard to the Adjoining Properties, the Authors understand that URE is contemplating a major exploration program(s) to continue the exploration and evaluation of the multiple stacked sinuous mineralized redox fronts identified thus far by drilling on the Adjoining Properties. The Authors recommend that, by the step-by-step method suggested, this further exploration proceed. The exploration program would result in costs to URE in the range of $15 to $20 million.
|
Bailey, R.G. 1995. Description of the Ecoregions of the United States. USDA Forest Service Miscellaneous Publication 1391: 108.
CIM Council, 2003, Estimation of Mineral Resources and Mineral Reserves, Best Practice Guidelines, November 23, 2003, page 51.
CIM Council, 2003, Estimation of Mineral Resources and Mineral Reserves, Best Practice Guidelines, Uranium Specific Guidelines
Collentine M, Libra R, Feathers K, Hamden L. 1981. Occurrence and characteristics of ground water in the Great Divide and Washakie Basins, Wyoming. Wyoming Water Research Institute. Technical Report Vol. VI-A.
Fisk EP. 1967. Groundwater geology and hydrology of the Great Divide and Washakie Basins, south-central Wyoming [master's thesis]. [Los Angeles (CA)]: University of Southern California.
Hydro-Engineering, LLC. 2007. Lost Creek aquifer test analyses. Prepared for Ur-Energy USA,Inc. March 2007.
Hydro-Search, Inc. 1982. 1982 Hydrogeology program for the Conoco/Lost Creek uranium project. Golden (CO). Prepared for Texasgulf, Inc.
Lyntek, Inc., 2008. Amended NI-43-101 Preliminary Assessment for the Lost Creek Project Sweetwater County, Wyoming. John I Kyle P.E., Douglas K. Maxwell P.E., April 2nd, 2008, as amended February 25, 2011 (As amended, with C. Stewart Wallis, P.Geo., co-author).
Maxim Technologies, Inc./Tetra Tech Inc. 2005a. Geotechnical Test Summary. Prepared for Ur-Energy by Energy Laboratories, Inc. Project Number 6550913. Report Number 8468. October 24, 2005.
Preliminary Assessment, Lost Creek Property
Maxim Technologies, Inc./Tetra Tech Inc. 2005b. Geotechnical Test Summary. Prepared for Ur-Energy by Energy Laboratories, Inc. Project Number 6550913. Report Number 8519. December 8, 2005.
Maxim Technologies, Inc./Tetra Tech Inc. 2006. Geotechnical Test Summary. Prepared for Ur- Energy by Energy Laboratories, Inc. Project Number 6550913. Report Number 8547. January 5, 2006.
MineWeb, 2011. Australian Junior on Course for American Uranium Project [Web Page] http://www.mineweb.com/mineweb/view/mineweb/en/page66?oid=41335&sn=Detail Accessed March 7, 2011.
National Environmental Policy Act “NEPA” 42 USC §4321 et seq.
Petrotek Engineering Corporation, 2007. “Lost Creek Regional Hydrologic Testing Report – Lost Creek Project Sweetwater County, Wyoming”. Report by Petrotek Engineering Corporation, October, 2007.
RBC Dominion Securities Inc., Uranium Market Outlook, Fourth Quarter 2010, Price Forecast
RPA (Roscoe Postle Associates, Inc), 2006. NI 43-101 Technical Report on the Lost Creek Project, Wyoming Prepared for Ur-Energy Inc. Report by Stewart Wallis, P. G. June 15, 2006.
SKM, 1997. “Red Desert Project Scoping Evaluation”; April 22, 1997, Stephen Morzenti/SKM Associates, for Strathmore Resources.
Tetra Tech Inc. 2008. Permeability Test Report. Prepared for Ur-Energy by Energy Laboratories, Inc. Project Number: C08100715. File Number: 27. November 7, 2008.
Texasgulf Minerals and Metals, Inc., (1984): Lost Creek and Conoco Uranium Projects, Sweetwater County, Wyoming: Private Report 33 pp.
Ur-Energy. 2007a. Lost Creek ISR, LLC, Lost Creek ISR Project, Wyoming DEQ Permit to Mine Application”, December, 2007.
Ur-Energy. 2007b. Lost Creek ISR, LLC, Application for US NRC Source and Byproduct Material License (Docket No. 40-9068), Technical Report, October, 2007.
US Nuclear Regulatory Commission, 1980, Generic Environmental Impact Statement for Uranium Mills, NUREG-0706.
US Nuclear Regulatory Commission, 2009, Generic Environmental Impact Statement for In-Situ Milling Facilities, NUREG-1910.
Weatherford Laboratories. 2010. Summary of Routine Core Analysis Results. Prepared for Ur- Energy by Energy Laboratories, Inc. Report Number C10010037. March 1, 2010.
Preliminary Assessment, Lost Creek Property
|
25.0
|
Date and Signature Page and Certification
|
This NI 43-101 technical report titled “Lost Creek Property Preliminary Assessment”, Sweetwater County, Wyoming, U.S.A dated March16, 2011 has been prepared and signed by the following authors.
|
/s/Douglass H. Graves
|
/s/ Matthew J. Yovich
|
|
Douglass Graves, P.E.
|
Matthew J. Yovich, P.E.
|
/s/Robert D. Maxwell
Robert D. Maxwell CPG #10913
Dated at Casper, Wyoming
March 16, 2011
Preliminary Assessment, Lost Creek Property
CERTIFICATE OF QUALIFIED PERSON
Preliminary Assessment Lost Creek Property, March 16, 2011
I, Douglass H. Graves, P.E., of 1800 West Koch, Bozeman, Montana, USA, do hereby certify that:
|
|
·
|
I have been retained by URE of 5880 Enterprise Drive #200, Casper Wyoming, 82609 to manage, coordinate and develop the documentation for the Lost Creek Project Preliminary Assessment.
|
|
|
·
|
I am a principal and President of TREC, Inc., 1800 West Koch, Bozeman, Montana, USA.
|
|
|
·
|
I graduated with a Bachelor of Science degree in Watershed Sciences from Colorado State University in 1975, and graduated with a Bachelor of Science degree in Civil Engineering from Montana State University in 1982.
|
|
|
·
|
I am a Professional Engineer in Wyoming, Montana, Colorado, South Carolina, Arizona, Idaho, Michigan, Oklahoma and Missouri. I am a member of Society for Mining, Metallurgy .and Exploration.
|
|
|
·
|
I have worked as an Engineer for 36 years, and have been a Professional Engineer for 27 years.
|
|
|
·
|
I have read the definition of “qualified person” set out in National Instrument (NI) 43-101 and certify by reason of my education, professional registration and relevant work experience, I fulfill the requirements to be a “qualified person” for the purposes of NI 43-101.
|
|
|
·
|
I have not visited the Lost Creek site but, in preparation of this report, I have communicated and coordinated with my co-author, Mr. Yovich, who visited the Lost Creek site during the preparation of this report.
|
|
|
·
|
I am responsible for the coordination and compilation of the Preliminary Assessment Lost Creek Property dated March16, 2011. I coordinated and assisted in the development of the various cost estimates, summaries, analyses, risk evaluation and recommendations. I am responsible for all aspects of this report, except for Sections 15 and 19.
|
|
|
·
|
I am independent of the issuer applying all of the tests of NI 43-101.
|
|
|
·
|
I have had prior involvement with the Lost Creek Project as I am the engineer of record for the design of the Lost Creek Project uranium processing plant.
|
|
|
·
|
I have read the NI 43-101 and this Preliminary Assessment Lost Creek Property has been prepared in compliance with NI 43-101.
|
|
|
·
|
As of the date of the certificate, to the best of my knowledge, information and belief, the Preliminary Assessment contains all scientific and technical information that is required to be disclosed to make the Preliminary Assessment not misleading.
|
Dated this 16th day of March, 2011
Signed and Sealed
/s/ Douglass H. Graves
Douglass H. Graves, P.E.
Preliminary Assessment, Lost Creek Property
CERTIFICATE OF QUALIFIED PERSON
Preliminary Assessment Lost Creek Property, March 16, 2011
I, Matthew J. Yovich, P.E., of 1800 West Koch, Bozeman, Montana, USA, do hereby certify that:
|
|
·
|
I have been retained by Ur-Energy Inc. of 10758 W. Centennial Road, Suite 200, Littleton, Colorado, 80127, to manage, coordinate and develop this Preliminary Assessment, Lost Creek Property.
|
|
|
·
|
I am a principal and Vice President of TREC, Inc., 1800 West Koch, Bozeman, Montana, USA.
|
|
|
·
|
I graduated with a Bachelor of Science degree in Civil Engineering from University of Wyoming in 1987.
|
|
|
·
|
I am a Professional Engineer in Montana. I am a member of the Society for Mining, Metallurgy, and Exploration.
|
|
|
·
|
I have worked as an Engineer for 24 years, and have been a Professional Engineer for 16 years.
|
|
|
·
|
I have read the definition of “qualified person” set out in National Instrument (NI) 43-101 and certify by reason of my education, professional registration and relevant work experience, I fulfill the requirements to be a “qualified person” for the purposes of NI 43-101.
|
|
|
·
|
I visited the Lost Creek site on March 5, 2011, in order to observe the geography and geology of the Project site, verify work done at the site by Ur-Energy, observe the potential locations of Project components, current site activities, the location of exploration activities and gain knowledge on existing site infrastructure.
|
|
|
·
|
I am responsible for all aspects of this report, except for Sections 15 and 19.
|
|
|
·
|
I am independent of the issuer applying all of the tests of NI 43-101.
|
|
|
·
|
I have had minor prior involvement with the Lost Creek Project as I assisted in portions of the design for the Processing Plant Facilities for the Lost Creek Project.
|
|
|
·
|
I have read the NI 43-101 and the Preliminary Assessment Lost Creek Property has been prepared in compliance with NI 43-101.
|
|
|
·
|
As of the date of this certificate, to the best of my knowledge, information and belief, the Preliminary Assessment contains all scientific and technical information that is required to be disclosed to make the Preliminary Assessment not misleading.
|
Dated this 16th day of March, 2011
Signed and Sealed
/s/ Matthew J. Yovich
Matthew J. Yovich, P.E.
Preliminary Assessment, Lost Creek Property
CERTIFICATE OF QUALIFIED PERSON
Preliminary Assessment Lost Creek Property, March 16, 2011
I, Robert D. Maxwell, of 1461 Trojan Drive, Casper Wyoming, USA, do hereby certify that:
|
|
·
|
I have been retained by TREC Inc. of 951 Werner Court #395, Casper Wyoming 82601 for portions of this Preliminary Assessment Lost Creek Property.
|
|
|
·
|
I am a Senior Associate of Behre Dolbear & Company (USA), Inc. 999 Eighteenth Street, Suite 1500, Denver, Colorado, USA.
|
|
|
·
|
I graduated with a Bachelor of Science degree in Geology from Texas Western College (UTEP) in 1964, and graduated with an MBA degree from the University of Colorado at Denver in 1991.
|
|
|
·
|
I am a Certified Professional Geologist (AIPG).
|
|
|
·
|
I have worked as a Geologist for thirty six years and as a CPG for six years. I am a member of the American Institute of Professional Geologists.
|
|
|
·
|
I have read the definition of “qualified person” set out in National Instrument (NI) 43-101 and certify by reason of my education, professional registration and relevant work experience, I fulfill the requirements to be a “qualified person” for the purposes of NI 43-101.
|
|
|
·
|
I have not made a recent site visit to the Lost Creek site. I have, however, during the preparation of this report, communicated and coordinated with my co-author Mr. Yovich. As well, I have first-hand historical knowledge of the area of the Lost Creek site, having worked in the Great Divide Basin of Wyoming , including in areas at and around Lost Creek.
|
|
|
·
|
I am responsible for Sections 8 through 17, 19 and 20 of the Preliminary Assessment Lost Creek Property dated March16, 2011.
|
|
|
·
|
I am independent of the issuer applying all of the tests of NI 43-101.
|
|
|
·
|
I have no prior involvement with Ur-Energy’s Lost Creek Project as such. I evaluated the previous owner’s position for Rio Algom Mining Corporation in the late 1990s.
|
|
|
·
|
I have read NI 43-101 and this Preliminary Assessment Lost Creek Property has been prepared in compliance with NI 43-101 and Form 43-101F.
|
|
|
·
|
As of the date of this Certificate, to the best of my knowledge, information, and belief, Sections 8 – 17, and 19 - 20 of the Preliminary Assessment contain all the scientific and technical information that is required to be disclosed to make the Preliminary Assessment not misleading.
|
Signed and sealed
/s/Robert D. Maxwell, CPG
Robert D. Maxwell CPG #10913
Preliminary Assessment, Lost Creek Property
Preliminary Assessment, Lost Creek Property
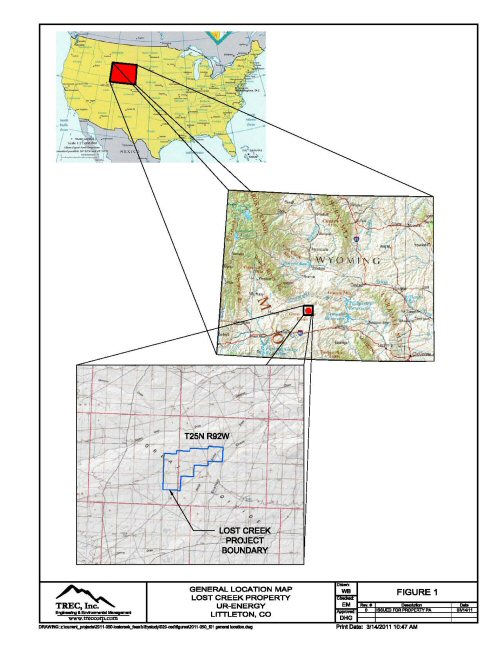
Preliminary Assessment, Lost Creek Property
Preliminary Assessment, Lost Creek Property
Preliminary Assessment, Lost Creek Property
Preliminary Assessment, Lost Creek Property
Preliminary Assessment, Lost Creek Property
Preliminary Assessment, Lost Creek Property
Preliminary Assessment, Lost Creek Property
Preliminary Assessment, Lost Creek Property
Preliminary Assessment, Lost Creek Property
Preliminary Assessment, Lost Creek Property
Preliminary Assessment, Lost Creek Property
Preliminary Assessment, Lost Creek Property
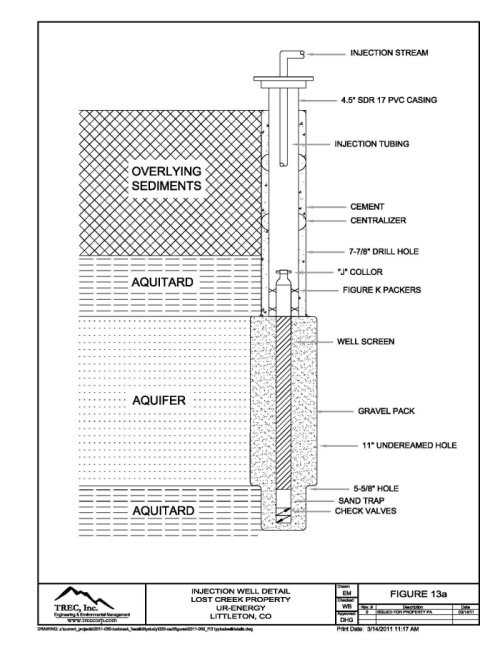
Preliminary Assessment, Lost Creek Property
Preliminary Assessment, Lost Creek Property
Preliminary Assessment, Lost Creek Property
Preliminary Assessment, Lost Creek Property
Preliminary Assessment, Lost Creek Property
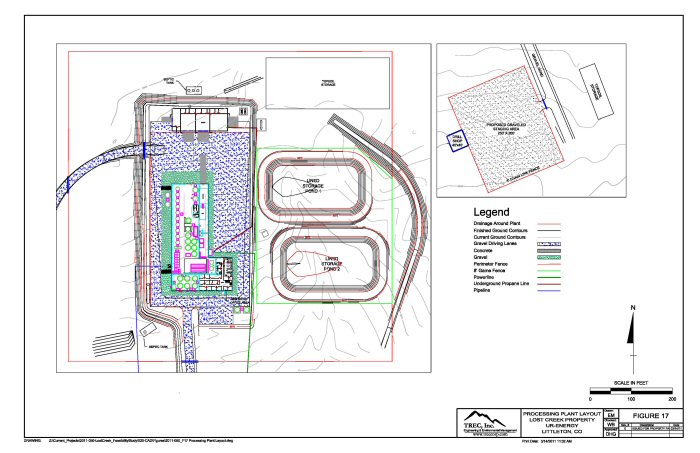
Preliminary Assessment, Lost Creek Property